. 2007 Jan 1;578(Pt 1):69-84.
doi: 10.1113/jphysiol.2006.117945. Epub 2006 Oct 5.

Effects of flecainide and quinidine on arrhythmogenic properties of Scn5a+/Delta murine hearts modelling long QT syndrome 3

Affiliations

Effects of flecainide and quinidine on arrhythmogenic properties of Scn5a+/Delta murine hearts modelling long QT syndrome 3

Kate S Stokoe et al. J Physiol. .

Abstract

Long QT3 (LQT3) syndrome is associated with incomplete Na+ channel inactivation, abnormal repolarization kinetics and prolonged cardiac action potential duration (APD). Electrophysiological effects of flecainide and quinidine were compared in Langendorff-perfused wild-type (WT), and genetically modified (Scn5a+/Delta) murine hearts modelling LQT3. Extra stimuli (S2) following trains of pacing stimuli (S1) applied to the right ventricular epicardium triggered ventricular tachycardia (VT) in 16 out of 28 untreated Scn5a+/Delta and zero out of 12 WT hearts. Paced electrogram fractionation analysis then demonstrated increased electrogram durations (EGD), expressed as EGD ratios, in arrhythmogenic Scn5a+/Delta hearts, and prolonged ventricular effective refractory periods in initially non-arrhythmogenic Scn5a+/Delta hearts. Nevertheless, comparisons of epicardial and endocardial monophasic action potential recordings demonstrated negative transmural repolarization gradients in both groups, giving DeltaAPD(90) values at 90% repolarization of -20.88 +/- 1.93 ms (n = 11) and -16.91 +/- 1.43 ms (n = 23), respectively. Flecainide prevented initiation of VT in 13 out of 16 arrhythmogenic Scn5a+/Delta hearts, reducing EGD ratio and restoring DeltaAPD90 to + 7.55 +/- 2.24 ms (n = 9) (P < 0.05). VT occurred in four out of eight non-arrhythmogenic Scn5a+/Delta hearts in the presence of quinidine, which increased EGD ratio but left DeltaAPD90 unchanged. In contrast (P < 0.05), WT hearts had positive DeltaAPD90 values (+ 11.72 +/- 2.17 ms) (n = 20). Flecainide then increased arrhythmic tendency and EGD ratio but conserved DeltaAPD90; reduced EGD ratios and unaltered DeltaAPD90 values accompanied the lower arrhythmogenicity associated with quinidine treatment. In addition to the changes in EGD ratio shown by WT hearts, these findings attribute arrhythmogenesis and its modification by flecainide and quinidine to alterations in DeltaAPD90 in Scn5a+/Delta hearts. This is consistent with a hypothesis in which incomplete Na+ channel inactivation in Scn5a+/Delta hearts generates functional substrates dependent on altered refractoriness that cause abnormalities in activation and conduction of subsequent cardiac impulses. Any spatial heterogeneities between the epicardial and endocardial layers would thus cause fragmentation of the activation wavefront and contribute to electrogram spreading.


Figures

Figure 1
Figure 1. Bipolar electrogram traces recorded during programmed electrical stimulation
A, an extra-cellular bipolar electrogram (BEG) trace showing ventricular tachycardia (VT) induced by an extra-stimulus (stim2) at 8 Hz in a typical, untreated arrhythmogenic Scn5a+/Δ whole mouse heart preparation. B, persistent, regular rhythm recorded during perfusion with (5.0 μm) flecainide. Each stimulation artefact (S1, S2) is followed closely by an evoked electrogram (S1EG, S2EG). The vertical axis represents BEG voltages (V) and the horizontal axis time (ms). The single vertical markers indicate the timing of S1 stimuli (stim1), with double vertical markers representing S2 extra-stimuli. Both traces were acquired after 80.6 s of programmed electrical stimulation (PES).
Figure 2
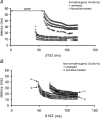
Figure 2. Conduction curves derived from paced electrogram fractionation analysis
Conduction curves generated by application of paced electrogram fractionation analysis (PEFA) to bipolar electrogram data acquired from arrhythmogenic (A) and non-arrhythmogenic (B) Scn5a+/Δ hearts in the presence (○) and absence (+) of flecainide (5.0 μm: A) and quinidine (10 μm: B) at 8 Hz. The vertical axis denotes latency (ms) and the horizontal axis S1S2 interval (ms). The arrow represents the ventricular effective refractory period (VERP).
Figure 3
Figure 3. The effects of pharmacological intervention on electrogram duration
Expanded BEG traces recorded during PES at 8 Hz from arrhythmogenic (A and B) and non-arrhythmogenic (C and D) Scn5a+/Δ hearts in the absence (A and C) and presence of flecainide (5.0 μm: B) and quinidine (10 μm: D). Each stimulation artefact (S1, S2) is followed closely by an evoked electrogram. The arrows represent electrogram duration (EGD).
Figure 4
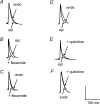
Figure 4. Monophasic action potential waveforms recorded from WT hearts
Monophasic action potentials (APs) recorded from the epicardium and endocardium of typical WT hearts paced at 8 Hz prior to and during treatment with flecainide (10 μm: B and C) and quinidine (10 μm: E and F). The top panel shows epicardial and endocardial MAPs overlaid to emphasize waveform differences in untreated hearts (A and D). The lower two panels illustrate the effects of flecainide and quinidine on AP waveform by superimposing records obtained from the epicardium (‘epi’: B and E) and endocardium (‘endo’: C and F) before (designated ‘epi’ or ‘endo’) and during treatment (‘+ flecainide’ or ‘ + quinidine’).
Figure 5
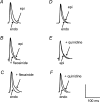
Figure 5. Monophasic action potential waveforms recorded from Scn5a+/Δ hearts
Monophasic action potentials (APs) recorded from the epicardium and endocardium of typical arrhythmogenic (A–C) and non-arrhythmogenic (D–F) Scn5a+/Δ hearts paced at 8 Hz prior to and during treatment with flecainide (5.0 μm: B and C) and quinidine (10 μm: E and F). The top panel shows epicardial and endocardial MAPs overlaid to emphasize waveform differences in untreated hearts (A and D). The lower two panels illustrate the effects of flecainide and quinidine on AP waveform by superimposing records obtained from the epicardium (‘epi’: B and E) and endocardium (‘endo’: C and F) before (designated ‘epi’ or ‘endo’) and during treatment (‘+ flecainide’ or ‘+ quinidine’).
Figure 6
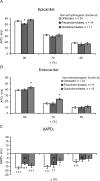
Figure 6. Action potential durations in WT hearts
Epicardial (A) and endocardial (B) action potential durations (APDx) and the empirical difference (ΔAPDx = endocardial APDx – epicardial APDx) (C) at x = 90%, 70% and 50% repolarization (ms) (mean ± s.e.m.) in WT hearts paced at 8 Hz in the absence (open bars) and presence of flecainide (10 μm: crossed bars) and quinidine (10 μm: striped bars). The results of one-way ANOVA for correlated samples are shown (P < 0.05 (*), P < 0.005 (**) and P < 0.0005 (***)) and compare the relative effects of pharmacological intervention; an asterisk(s) indicates that treatment significantly altered APDx relative to corresponding untreated controls. ΔAPDx values tested against a zero ΔAPDx are shown to significance levels of P < 0.05 (†), P < 0.01 (††) and P < 0.001 (†††), respectively. ΔAPDx values obtained from hearts treated with flecainide or quinidine are also compared to values obtained from untreated hearts to significance levels of P < 0.05 (§), P < 0.01 (§§) and P < 0.001 (§§§), respectively.
Figure 7
Figure 7. Action potential durations in arrhythmogenic Scn5a+/Δ hearts
Epicardial (A) and endocardial (B) action potential durations (APDx) and the empirical difference (ΔAPDx = endocardial APDx – epicardial APDx) (C) at x = 90%, 70% and 50% repolarization (ms) (mean ± s.e.m.) in arrhythmogenic Scn5a+/Δ hearts paced at 8 Hz in the absence (open bars) and presence of flecainide (5.0 μm: crossed bars). The results of one-way ANOVA for correlated samples are shown (P < 0.05 (*), P < 0.005 (**) and P < 0.0005 (***)) and compare the relative effects of pharmacological intervention; an asterisk(s) indicates that treatment significantly altered APDx relative to corresponding untreated controls. ΔAPDx values tested against a zero ΔAPDx are shown to significance levels of P < 0.05 (†), P < 0.01 (††) and P < 0.001 (†††), respectively. ΔAPDx values obtained from hearts treated with flecainide are also compared to values obtained from untreated hearts to significance levels of P < 0.05 (§), P < 0.01 (§§) and P < 0.001 (§§§), respectively.
Figure 8
Figure 8. Action potential durations in non-arrhythmogenic Scn5a+/Δ hearts
Epicardial (A) and endocardial (B) action potential durations (APDx) and the empirical difference (ΔAPDx = endocardial APDx – epicardial APDx) (C) at x = 90%, 70% and 50% repolarization (ms) (mean ± s.e.m.) in Scn5a+/Δ hearts paced at 8 Hz in the absence (open bars) and presence of flecainide (5.0 μm: crossed bars) and quinidine (10 μm: striped bars). The results of one-way ANOVA for correlated samples are shown (P < 0.05 (*), P < 0.005 (**) and P < 0.0005 (***)) and compare the relative effects of pharmacological intervention; an asterisk(s) indicates that treatment significantly altered APDx relative to corresponding untreated controls. ΔAPDx values tested against a zero ΔAPDx are shown to significance levels of P < 0.05 (†), P < 0.01 (††) and P < 0.001 (†††), respectively. ΔAPDx values obtained from hearts treated with flecainide or quinidine are also compared to values obtained from untreated hearts to significance levels of P < 0.05 (§), P < 0.01 (§§) and P < 0.001 (§§§), respectively.

References

    1. Abriel H, Wehrens XH, Benhorin J, Kerem B, Kass RS. Molecular pharmacology of the sodium channel mutation D1790G linked to the long–QT syndrome. Circulation. 2000;102:921–925. - PubMed
    1. Alings M, Dekker L, Sadee A, Wilde A. Quinidine-induced electrocardiographic normalization in two patients with Brugada syndrome. Pacing Clin Electrophysiol. 2001;24:1420–1422. - PubMed
    1. Alings M, Wilde A. ‘Brugada’ syndrome: clinical data and suggested pathophysiological mechanism. Circulation. 1999;99:666–673. - PubMed
    1. Antzelevitch C, Dumaine R. Electrical heterogeneity in the heart: physiological, pharmacological and clinical implication. In: Page E, Fozzard HA, Solaro RJ, editors. Handbook of Physiology. New York: Oxford University Press; 2001. pp. 654–692.
    1. Antzelevtich C, Fish J. Electrical heterogeneity within the ventricular wall. Basic Res Cardiol. 2001;96:517–527. - PubMed

Publication types

MeSH terms

LinkOut - more resources