. 2006 Oct 17;103(42):15434-9.
doi: 10.1073/pnas.0606701103. Epub 2006 Oct 5.

Similarities between heterophilic and homophilic cadherin adhesion

Affiliations

Similarities between heterophilic and homophilic cadherin adhesion

A K Prakasam et al. Proc Natl Acad Sci U S A. .

Abstract

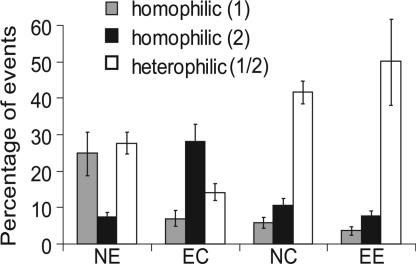
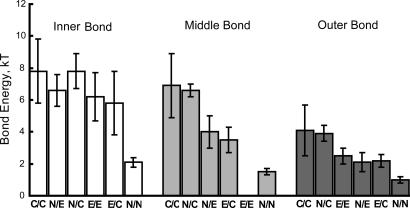
The mechanism that drives the segregation of cells into tissue-specific subpopulations during development is largely attributed to differences in intercellular adhesion. This process requires the cadherin family of calcium-dependent glycoproteins. A widely held view is that protein-level discrimination between different cadherins on cell surfaces drives this sorting process. Despite this postulated molecular selectivity, adhesion selectivity has not been quantitatively verified at the protein level. In this work, molecular force measurements and bead aggregation assays tested whether differences in cadherin bond strengths could account for cell sorting in vivo and in vitro. Studies were conducted with chicken N-cadherin, canine E-cadherin, and Xenopus C-cadherin. Both qualitative bead aggregation and quantitative force measurements show that the cadherins cross-react. Furthermore, heterophilic adhesion is not substantially weaker than homophilic adhesion, and the measured differences in adhesion do not correlate with cell sorting behavior. These results suggest that the basis for cell segregation during morphogenesis does not map exclusively to protein-level differences in cadherin adhesion.


Conflict of interest statement

The authors declare no conflict of interest.

Figures

Fig. 1.
Fig. 1.
Protein configurations in the force measurements. (a) Cadherin monolayer architecture used in SFA measurements. D is the absolute separation between the bilayer surfaces, and T is the distance between the DPPE monolayers. (b) Proposed cadherin ectodomain alignments at the three different membrane separations at which the proteins adhere.
Fig. 2.
Fig. 2.
Normalized force–distance profiles for homophilic interactions between C-CAD (a), E-CAD (b), and N-CAD (c). Filled circles show the normalized force versus distance during approach (decreasing D). Open circles show the positions and magnitudes of the adhesive minima (F/R < 0) measured during separation (increasing D). The arrows show distances at which the cadherin bonds rupture. The vertical dashed lines correspond to the positions of bond failure.
Fig. 3.
Fig. 3.
Normalized force–distance profiles for heterophilic interactions between C- and E-CAD (a), N- and E-CAD (b), and C- and N-CAD (c). The filled circles indicate the normalized force versus distance during approach (decreasing D). Open circles show the positions and magnitudes of the adhesive minima (F/R < 0) measured during separation (increasing D). The arrows indicate protein–protein bond failure. The vertical dashed lines show the positions of bond failure.
Fig. 4.
Fig. 4.
2D plots of distributions of red and green beads in aggregates quantified by flow cytometry. (a and b) Distribution of homophilic aggregates formed by mixing red and green beads coated with E-CAD in the presence (a) and absence (b) of calcium. The vertical axis is the green fluorescence intensity caused by green E-CAD-coated beads, and the horizontal axis shows the red fluorescence from red E-CAD-coated beads. The region P8 defines aggregates containing both red and green beads. Sectors P1 and P2 indicate isolated red and green beads, respectively. Sectors P3 and P4 define homoaggregates of red and green beads, respectively. Regions P6 and P7 quantify aggregates containing only one red or green bead in a larger aggregate. (c and d) Aggregates formed by mixing N-CAD and E-CAD beads in the presence (c) and absence (d) of calcium. The different sectors are defined as in a and b.
Fig. 5.
Fig. 5.
Percentage of homoaggregates (gray and black bars) and heteroaggregates (open bars). The cadherin combinations are indicated below the histograms. The first letter in the pair is shown by the first (gray) bar, and the second (black) bar represents the second letter of the pair.
Fig. 6.
Fig. 6.
Average energies of homophilic and heterophilic cadherin bonds. From left to right are the histograms, in decreasing order of bond energy, for the inner, middle, and outer cadherin bonds. The corresponding cadherin pairs are indicated below each bar.

References

    1. Gumbiner BM. Cell. 1996;84:345–357. - PubMed
    1. Steinberg MS. Proc Natl Acad Sci USA. 1962;48:1577–1582. - PMC - PubMed
    1. Steinberg MS, Takeichi M. Proc Natl Acad Sci USA. 1994;91:206–209. - PMC - PubMed
    1. Takeichi M. Science. 1991;251:1451–1455. - PubMed
    1. Takeichi Curr Opin Cell Biol. 1993;5:806–811. - PubMed

Publication types