. 2006 Oct 24;103(43):15739-46.
doi: 10.1073/pnas.0606422103. Epub 2006 Oct 5.

Recent progress in understanding hydrophobic interactions

Affiliations

Recent progress in understanding hydrophobic interactions

Emily E Meyer et al. Proc Natl Acad Sci U S A. .

Abstract

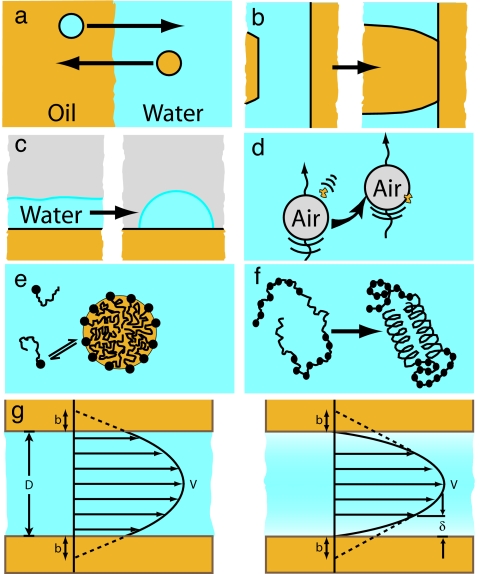
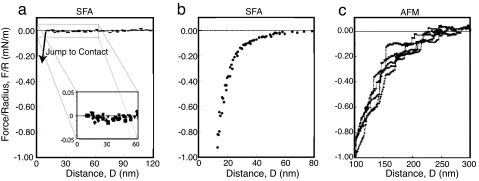
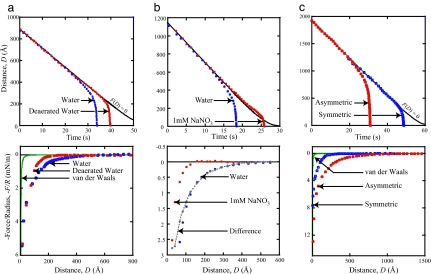
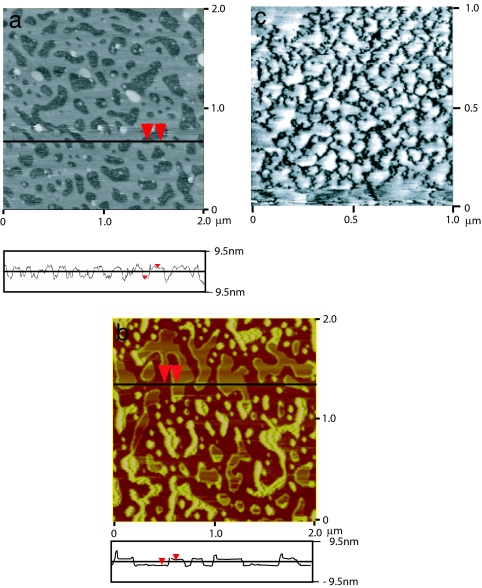
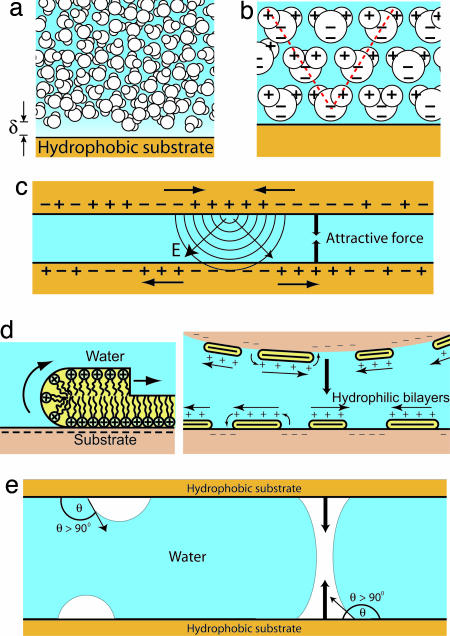
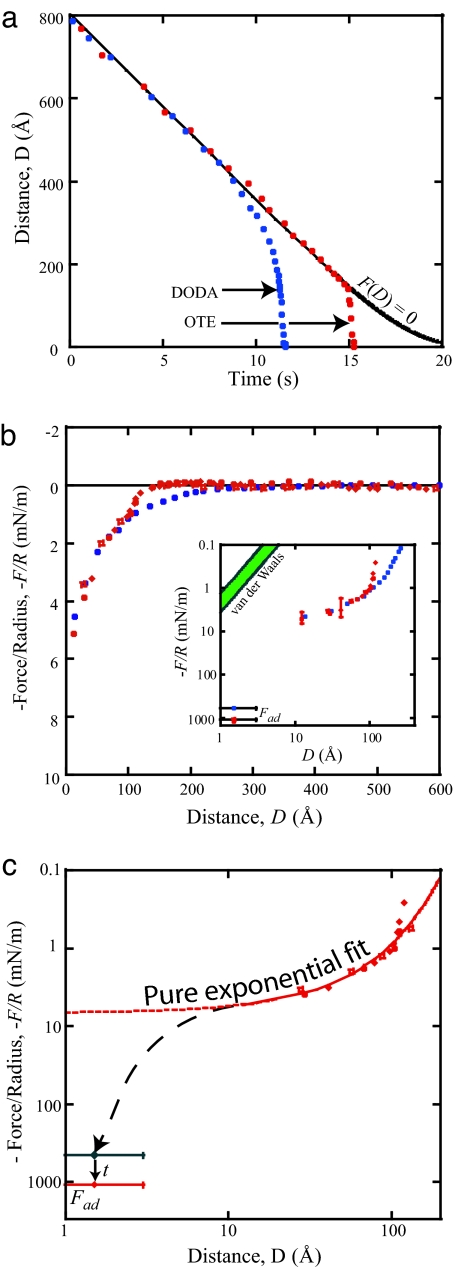
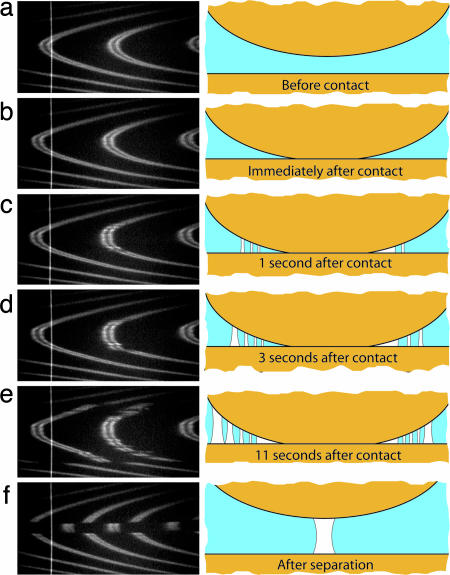
We present here a brief review of direct force measurements between hydrophobic surfaces in aqueous solutions. For almost 70 years, researchers have attempted to understand the hydrophobic effect (the low solubility of hydrophobic solutes in water) and the hydrophobic interaction or force (the unusually strong attraction of hydrophobic surfaces and groups in water). After many years of research into how hydrophobic interactions affect the thermodynamic properties of processes such as micelle formation (self-assembly) and protein folding, the results of direct force measurements between macroscopic surfaces began to appear in the 1980s. Reported ranges of the attraction between variously prepared hydrophobic surfaces in water grew from the initially reported value of 80-100 Angstrom to values as large as 3,000 Angstrom. Recent improved surface preparation techniques and the combination of surface force apparatus measurements with atomic force microscopy imaging have made it possible to explain the long-range part of this interaction (at separations >200 Angstrom) that is observed between certain surfaces. We tentatively conclude that only the short-range part of the attraction (<100 Angstrom) represents the true hydrophobic interaction, although a quantitative explanation for this interaction will require additional research. Although our force-measuring technique did not allow collection of reliable data at separations <10 Angstrom, it is clear that some stronger force must act in this regime if the measured interaction energy curve is to extrapolate to the measured adhesion energy as the surface separation approaches zero (i.e., as the surfaces come into molecular contact).


Conflict of interest statement

The authors declare no conflict of interest.

Figures

Fig. 1.
Fig. 1.
Manifestations of the hydrophobic interaction and the hydrophobic effect. These include the low solubility of hydrophobic solutes (e.g., oil) in water and vice versa (a), the strong adhesion between solid hydrophobic surfaces (b), the dewetting phenomena leading to a large contact angle (c), hydrophobic contaminants or pollution adsorbing at the air–water interface (d), micelle formation (e), protein folding (f), and flow through hydrophobic surfaces leading to an observed slip length at the solid–liquid interface (g). The slip length, b, is approximately related to the thickness of the depletion layer, δ, through b ≈ 50δ (122).
Fig. 2.
Fig. 2.
Representative force curves measured between surfaces hydrophobized by three different techniques. (a) Short-range attraction typical between stable surfaces. [Reproduced with permission from ref. (Copyright 1995, American Chemical Society).] (b) Long-range, biexponential attraction between physisorbed or self-assembled surfactant surfaces. (c) Step-like force curves indicative of bridging nanobubbles. [Reproduced with permission from ref. (Copyright 1994, American Chemical Society).]
Fig. 3.
Fig. 3.
Impact of deaeration (a), salt (b), and asymmetry (hydrophobic–hydrophilic interactions) (c) on the interaction between DODA-coated mica surfaces. (Upper) Distance vs. time curves. (Lower) Force vs. distance curves for the same system.
Fig. 4.
Fig. 4.
AFM images of hydrophobic surfaces prepared by different techniques imaged in various aqueous solutions. Shown are hydrophobic surfaces under water prepared by LB deposition of DODA on mica (a) and self-assembly of cetyltrimethylammonium bromide on mica (b). [b reproduced with permission from ref. (Copyright 2005, American Chemical Society).] (c) Nanobubbles on a hydrophobic glass substrate. [Reproduced with permission from ref. (Copyright 2002, American Chemical Society).]
Fig. 5.
Fig. 5.
Possible mechanisms for long-range attraction between hydrophobic surfaces. (a) Although a depletion layer exists next to a hydrophobic surface, the range of thickness of this layer is typically only one to two water molecules, suggesting that only a short-range force should be operating. (b) The presence of a hydrophobic solute (or ion) also affects the local orientation of the surrounding water molecules, an effect that can propagate many molecular layers into the bulk. (c and d) Local charge fluctuations at one surface can influence the charge density of the opposing surface, causing a long-range attractive electrostatic interaction, such as that seen with patchy bilayers. (e) When present on hydrophobic surfaces, nanobubbles can coalescence, leading to an attractive Laplace pressure at large range.
Fig. 6.
Fig. 6.
Representative data for forces between OTE surfaces deposited on activated mica. (a and b) Distance vs. time (a) and force vs. distance (b) data for the OTE system compared with that in the DODA system. (b Inset) The force curve on a log-log scale. (c) Force curve fit by an exponential function plotted along with measured and calculated adhesion values.
Fig. 7.
Fig. 7.
Fringes of equal chromatic order images and accompanying schematics of spontaneous cavitation when OTE surfaces jump into contact. (ae) The cavitation begins after contact and increases with time. (f) The single larger cavity that remains after separation.

Comment in

  • Profile of Jacob N. Israelachvili.
    Zagorski N. Zagorski N. Proc Natl Acad Sci U S A. 2006 Oct 24;103(43):15736-8. doi: 10.1073/pnas.0607766103. Epub 2006 Oct 16. Proc Natl Acad Sci U S A. 2006. PMID: 17043213 Free PMC article. No abstract available.

References

    1. Butler JAV. Trans Faraday Soc. 1937;33:229–236.
    1. Frank HS, Evans MW. J Chem Phys. 1945;13:507–532.
    1. Klotz IM. Science. 1958;128:815–822. - PubMed
    1. Kauzmann W. Adv Protein Chem. 1959;14:1–63. - PubMed
    1. Hildebrand JH, Nemethy G, Scheraga HA, Kauzmann W. J Phys Chem. 1968;72:1841–1842.

Publication types

MeSH terms

LinkOut - more resources