. 2007 Feb 15;109(4):1728-35.
doi: 10.1182/blood-2006-04-018630. Epub 2006 Oct 5.

Urea stimulation of KCl cotransport induces abnormal volume reduction in sickle reticulocytes

Affiliations

Urea stimulation of KCl cotransport induces abnormal volume reduction in sickle reticulocytes

Clinton H Joiner et al. Blood. .

Erratum in

  • Blood. 2007 Apr 1;109(7):2735

Abstract

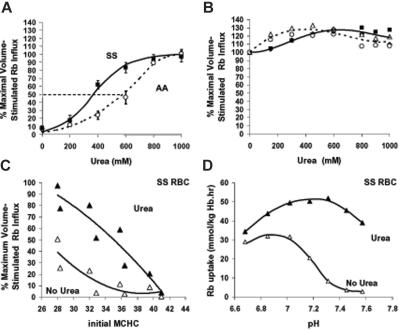
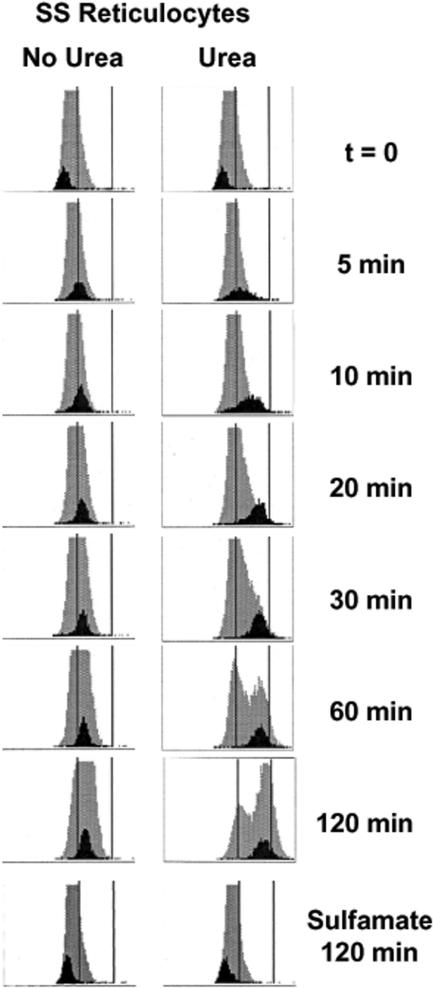
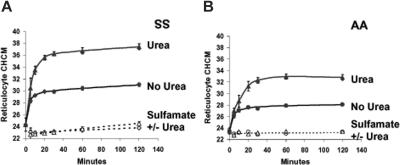
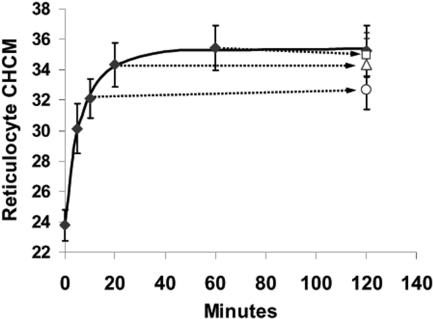
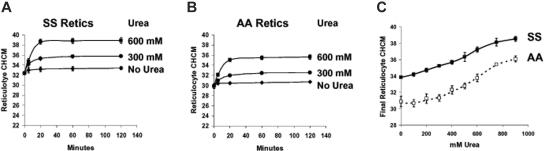
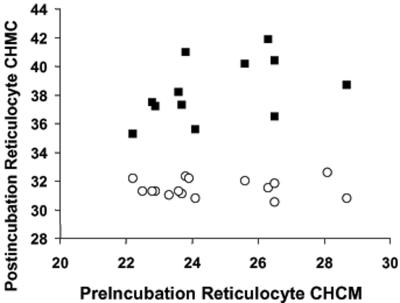
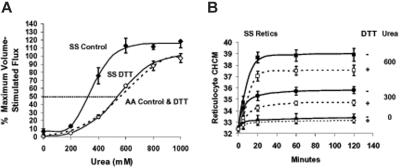
KCl cotransport (KCC) activity contributes to pathologic dehydration in sickle (SS) red blood cells (RBCs). KCC activation by urea was measured in SS and normal (AA) RBCs as Cl-dependent Rb influx. KCC-mediated volume reduction was assessed by measuring reticulocyte cellular hemoglobin concentration (CHC) cytometrically. Urea activated KCC fluxes in fresh RBCs to levels seen in swollen cells, although SS RBCs required lower urea concentrations than did normal (AA) RBCs. Little additional KCC stimulation by urea occurred in swollen AA or SS RBCs. The pH dependence of KCC in "euvolemic" SS RBCs treated with urea was similar to that in swollen cells. Urea triggered volume reduction in SS and AA reticulocytes, establishing a higher CHC. Volume reduction was Cl dependent and was limited by the KCC inhibitor, dihydro-indenyl-oxyalkanoic acid. Final CHC depended on urea concentration, but not on initial CHC. Under all activation conditions, volume reduction was exaggerated in SS reticulocytes and produced higher CHCs than in AA reticulocytes. The sulfhydryl-reducing agent, dithiothreitol, normalized the sensitivity of KCC activation to urea in SS RBCs and mitigated the urea-stimulated volume decrease in SS reticulocytes, suggesting that the dysfunctional activity of KCC in SS RBCs was due in part to reversible sulfhydryl oxidation.


Figures

Figure 1
Figure 1
Effect of urea on Rb influx in SS and AA RBCs. Fluxes were measured in unfractionated blood samples. (A) Rb influx versus urea concentration. Ouabain- and bumetanide-resistant (OBR) Rb influx was measured in HBS pH 7.4 in fresh RBCs (not swollen with nystatin) at various added urea concentrations and normalized to concurrently measured maximal volume-sensitive Rb influx in cells swollen to MCHC 270 g/L (27g/dL) or less by nystatin treatment. In Cl-free media, increasing urea concentration had no effect on OBR Rb influx (not shown). Symbols represent mean with error bars depicting SEM of 6 experiments. Curves were drawn by eye. The dashed line indicates 50% activation of KCC. (B) Rb influx versus urea concentration in swollen RBCs. Cells were swollen to initial MCHC 270 g/L (27 g/dL), and Rb influx was measured at various urea concentrations. Data are expressed as percentage of maximal volume stimulated flux ([urea] = 0). The 2 experiments shown with AA (open symbols) and SS (filled symbols) RBCs were independent of those in panel A. Lines were drawn by eye. (C) Rb influx versus MCHC in SS RBCs. Cells were swollen to various (initial) MCHC via nystatin treatment, and Rb influx was measured with 600 mM urea (▴) or without urea (▵). Maximal volume-stimulated flux was measured concurrently in cells with initial MCHC less than 270 g/L (27 g/dL) (without urea). Data are from 2 independent experiments. (D) Rb influx versus pH in SS RBCs. Rb influx was measured in fresh cells washed and incubated in HBS at various pH values. The acid-stimulated Rb influx is greater than 95% CI dependent and reflects KCC activity. When present, urea concentration was 600 mM (▴). Data are from a single experiment, representative of 3.
Figure 2
Figure 2
Advia 120 cellular hemoglobin concentration (CHC) frequency distributions in SS reticulocytes. Histograms for reticulocytes (black) are shown against the backdrop of the entire RBC population (gray) measured over time. The x-axis depicts CHC on a scale of 0-500 g/L (0-50 g/dL), and 280 and 410 g/L (28 and 41 g/dL) are represented by vertical lines. Cells were initially swollen (nystatin method) to 240 g/L (24 g/dL), then incubated in isotonic HEPES-buffered saline (HBS, pH 7.4) without (control) or with (urea) 600 mM urea. Samples were taken at various times, washed in HBS, and stored on ice until analyzed on the Advia 120. CHC distributions for cells incubated 2 hours in Cl-free media (sulfamate) without and with urea are also shown.
Figure 3
Figure 3
Effect of urea on volume reduction in sickle and normal reticulocytes. Cells were swollen by nystatin treatment and incubated in isotonic HBS pH 7.4 (no urea) or the same buffer plus 600 mM urea. (A-B) Sulfamate media were Cl free. Data points are means ± SEMs of 3 independent experiments. (C-D) Inhibition of DIOA. The concentration of KCC transport inhibitor, DIOA, when present, was 100 μM. Single experiments with SS and AA cells are depicted, representative of 2 others with both cell types.
Figure 4
Figure 4
Urea-stimulated volume reduction in SS reticulocytes is irreversible. Cells were treated with nystatin and incubated in HBS pH 7.4 plus 600 mM urea. The solid curve represents volume reduction in cells continuously exposed for 120 minutes. At 10, 20, and 60 minutes, samples were removed, centrifuged, and resuspended in HBS pH 7.4 without urea and incubated at 37°C for the duration of the 120-periond (open symbols, connected by arrows to the points representing their exposure time to urea). Data are means of 3 independent experiments, with error bars representing SEM.
Figure 5
Figure 5
Concentration dependence of urea-stimulated volume reduction in unswollen reticulocytes. Fresh cells were washed and incubated without prior nystatin treatment in HBS pH 7.4, with no urea (control) or with urea at concentrations indicated. Initial CHCM values reflect in vivo CHMC. (Symbols represent means of 3 independent experiments, with error bars depicting SEM where larger than the symbol.) (A) SS reticulocytes. (B) AA reticulocytes. (C) Dependence on urea concentration of reticulocyte CHCM after 2 hours of incubation for SS (filled symbols) and AA (open symbols) cells.
Figure 6
Figure 6
Final CHCM after KCC-mediated volume reduction is independent of initial CHCM in SS reticulocytes. Cells were incubated in HBS pH 7.4 ± 600 mM urea. CHCM values less than 300 g/L (30 g/dL) were achieved by nystatin treatment (as in Figure 1).
Figure 7
Figure 7
Effect of DTT treatment on urea stimulation of KCC and volume reduction in reticulocytes. Fresh cells were washed and preincubated 1 hour without (control, filled symbols) or with 10 mM DTT (open symbols) as described in “Materials and methods,” under “Dithiothreitol treatment.” Points are mean ± SEM (n = 4); curves were drawn by eye. A parallel set of experiments with AA RBCs ± DTT are represented by a dashed line drawn by eye to fit the data points, which were omitted for clarity. (A) Rb influx measured at various urea concentrations in HBS pH 7.4. Parallel measurements in cells swollen to CHCM less than 270 g/L (27 g/dL) by nystatin treatment (± DTT pretreatment) provided a measure of maximal volume stimulated flux for normalizing data. Data are means ± SEM from 3 experiments independent from Figure 1. DTT pretreatment had no effect on urea stimulation of KCC in AA RBCs; data from cells incubated with and without DTT were combined to calculate the dashed line representing AA cells. (B) Effect of DTT and urea on volume reduction in SS reticulocytes. Unswollen cells were incubated as in Figure 4 at indicated urea concentrations, either without (filled symbols) or with (open symbols) DTT pretreatment. CHCM at 120 minutes was lower with DTT treatment at both 300 and 600 mM urea (P < .003 and P < .03, respectively, n = 3).

References

    1. Adragna NC, Fulvio MD, Lauf PK. Regulation of K-Cl cotransport: from function to genes. J Membr Biol. 2004;201:109–137. - PubMed
    1. Gamba G. Molecular physiology and pathophysiology of electroneutral cation-chloride cotransporters. Physiol Rev. 2005;85:423–493. - PubMed
    1. Bize I, Taher S, Brugnara C. Regulation of K-Cl cotransport during reticulocyte maturation and erythrocyte aging in normal and sickle erythrocytes. Am J Physiol Cell Physiol. 2003;285:C31–C38. - PubMed
    1. Canessa M, Fabry ME, Blumenfeld N, Nagel RL. Volume-stimulated, Cl(-)-dependent K+ efflux is highly expressed in young human red cells containing normal hemoglobin or HbS. J Membr Biol. 1987;97:97–105. - PubMed
    1. Olivieri O, Vitoux D, Galacteros F, et al. Hemoglobin variants and activity of the (K+Cl-) cotransport system in human erythrocytes. Blood. 1992;79:793–797. - PubMed

Publication types