. 2006 Oct;25(10):1272-83.
doi: 10.1109/42.896783.

Penalized weighted least-squares approach to sinogram noise reduction and image reconstruction for low-dose X-ray computed tomography

Affiliations

Penalized weighted least-squares approach to sinogram noise reduction and image reconstruction for low-dose X-ray computed tomography

Jing Wang et al. IEEE Trans Med Imaging. 2006 Oct.

Abstract

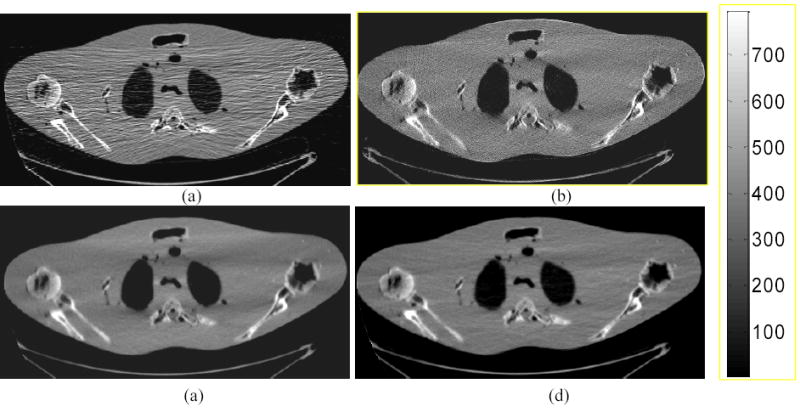
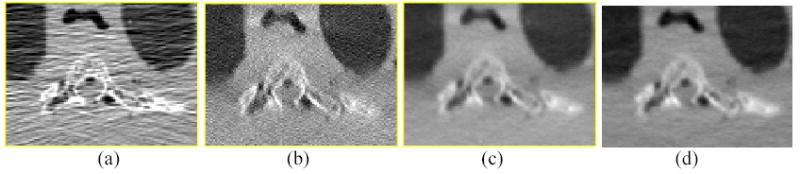
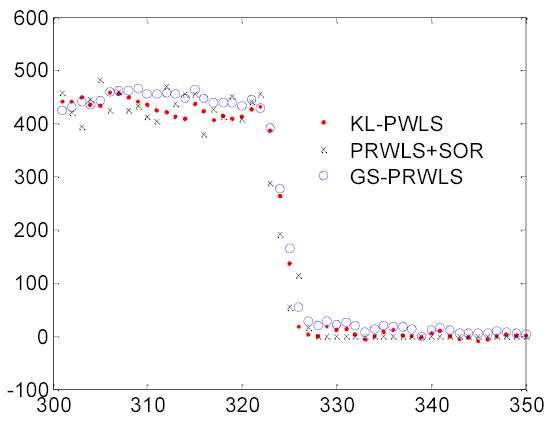
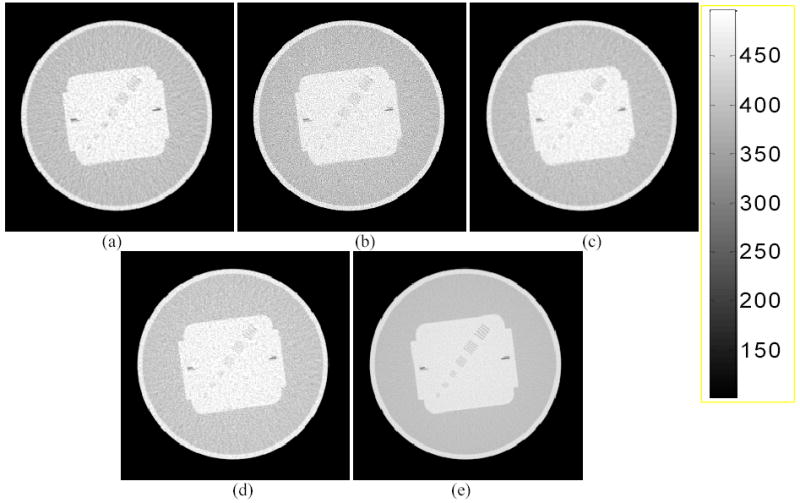
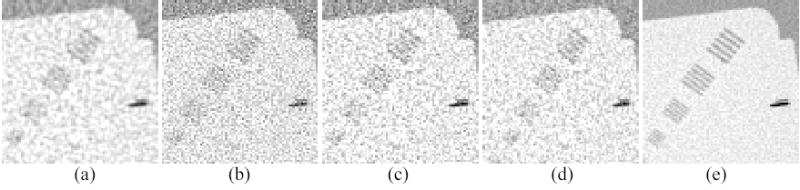
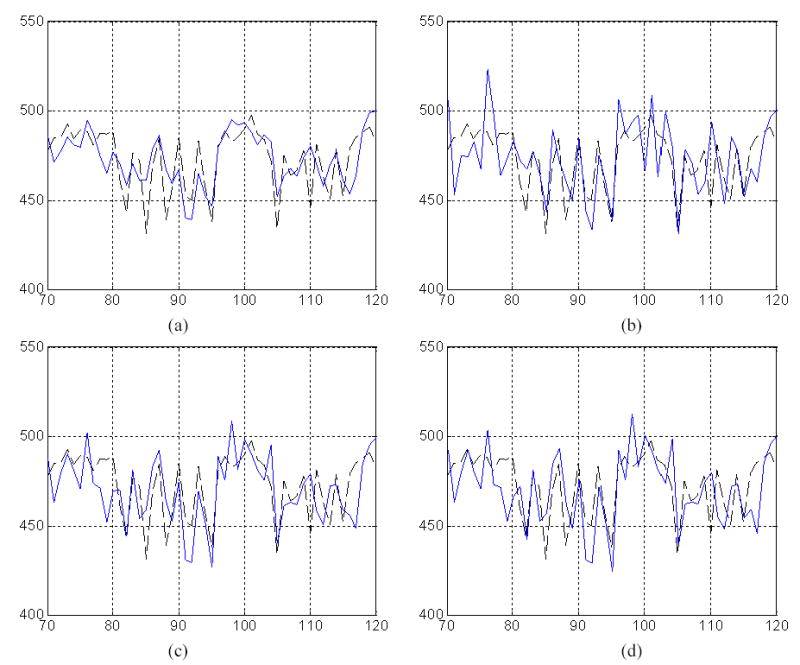
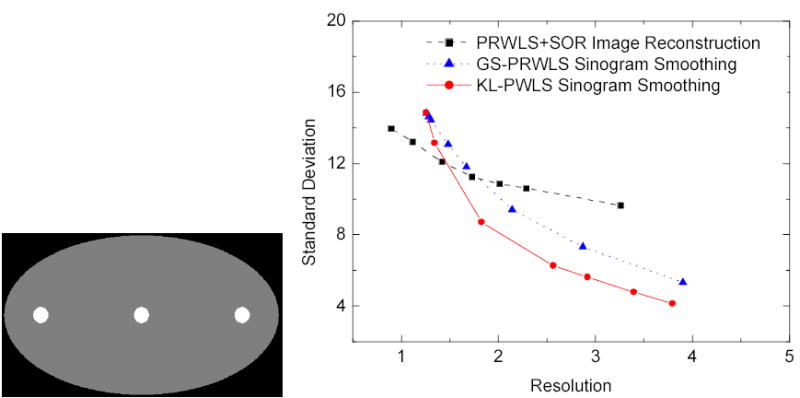
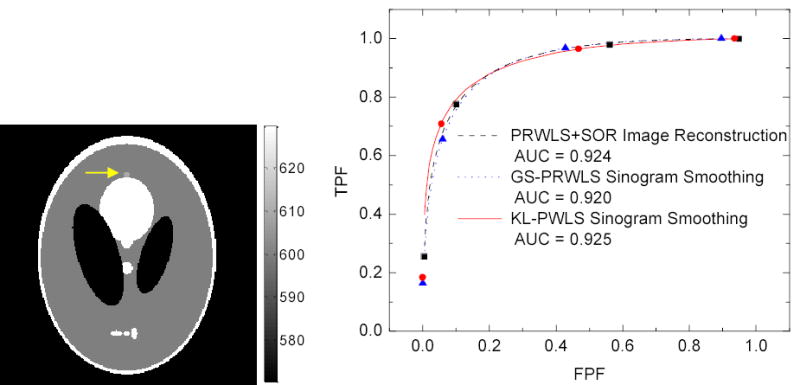
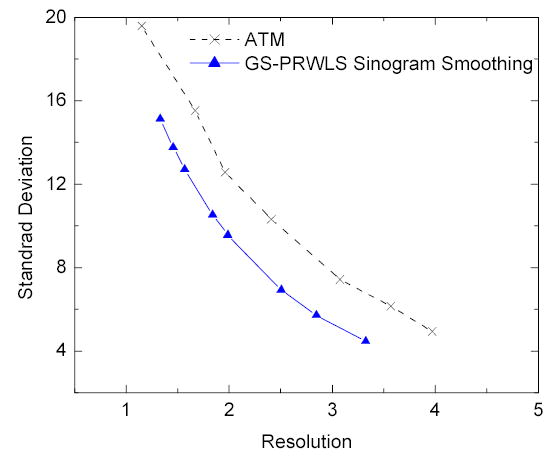
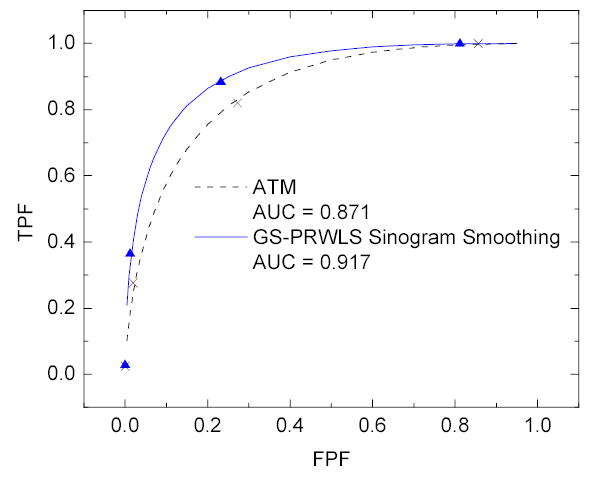
Reconstructing low-dose X-ray computed tomography (CT) images is a noise problem. This work investigated a penalized weighted least-squares (PWLS) approach to address this problem in two dimensions, where the WLS considers first- and second-order noise moments and the penalty models signal spatial correlations. Three different implementations were studied for the PWLS minimization. One utilizes a Markov random field (MRF) Gibbs functional to consider spatial correlations among nearby detector bins and projection views in sinogram space and minimizes the PWLS cost function by iterative Gauss-Seidel algorithm. Another employs Karhunen-Loève (KL) transform to de-correlate data signals among nearby views and minimizes the PWLS adaptively to each KL component by analytical calculation, where the spatial correlation among nearby bins is modeled by the same Gibbs functional. The third one models the spatial correlations among image pixels in image domain also by a MRF Gibbs functional and minimizes the PWLS by iterative successive over-relaxation algorithm. In these three implementations, a quadratic functional regularization was chosen for the MRF model. Phantom experiments showed a comparable performance of these three PWLS-based methods in terms of suppressing noise-induced streak artifacts and preserving resolution in the reconstructed images. Computer simulations concurred with the phantom experiments in terms of noise-resolution tradeoff and detectability in low contrast environment. The KL-PWLS implementation may have the advantage in terms of computation for high-resolution dynamic low-dose CT imaging.


Figures

Fig. 1
Fig. 1
Shoulder phantom study with 10 mA protocol. (a): A conventional FBP reconstructed image using the Hanning filter with cutoff at 80% Nyquist frequency. (b): Iterative PRWLS+SOR reconstructed image with β =1×10⁻⁴. (c): A standard FBP reconstructed image from the iterative GS-PRWLS smoothed sinogram with β =1×10⁻⁸. (d): A standard FBP reconstructed image from the analytical KL-PWLS filtered sinogram with β =200.
Fig. 2
Fig. 2
Zoomed images of a ROI from the corresponding images of Fig. 1: (a) Result from Hanning filter; (b) from the PRWLS+SOR strategy; (c) from the GS-PRWLS strategy; and (d) from the KL-PWLS strategy.
Fig. 3
Fig. 3
Vertical profiles through the reconstructed images of the three PWLS-based methods.
Fig. 4
Fig. 4
QA phantom study with 20 mA protocol. (a): A conventional FBP reconstructed image using the Hanning filter with cutoff at 80% Nyquist frequency. (b): Iterative PRWLS+SOR reconstructed image with β =1×10⁻⁴. (c): A standard FBP reconstructed image from the iterative GS-PRWLS smoothed sinogram with β =1×10⁻⁸. (d): A standard FBP reconstructed image from the analytical KL-PWLS filtered sinogram with β =200. (e): A standard FBP reconstructed image by the Ramp filter with 100% Nyquist frequency from the average of 19 repeated measurements (it is assumed as the gold standard in this phantom experiment).
Fig. 5
Fig. 5
Zoomed images of the sets of strip bars from the corresponding images of Fig. 4: (a) Result from the Hanning filter; (b) from the PRWLS+SOR strategy; (c) from the GS-PRWLS strategy; (d) from the KL-PWLS strategy; and (e) from the average of 19 repeated measurements (as the gold standard).
Fig. 6
Fig. 6
Profiles of two-pixel-width through the sets of the small strips in images of Fig. 4. The “solid-line” in (a) is from the Hanning filter, (b) from the PRWLS+SOR strategy, (c) from the GS-PRWLS strategy and (d) from the KL-PWLS strategy. The “dashed-line” in all of above figures is from the average of 19 repeated measurements (i.e., the gold standard).
Fig. 7
Fig. 7
Left is the phantom used for the noise-resolution tradeoff studies. Right shows the noise-resolution tradeoff curves for the presented three PWLS approaches. The resolution is measured by FWHM in pixel units.
Fig. 8
Fig. 8
Left picture is the modified Shepp-Logan head phantom used for ROC study. The right picture shows the results of the ROC evaluation and the fitted ROC curves by the binormal model.
Fig. 9
Fig. 9
Noise-resolution tradeoff curves of the ATM filter and the GS-PRWLS algorithm.
Fig. 10
Fig. 10
Results of the ROC evaluation and the fitted ROC curves of ATM filter and GS-PRWLS algorithm.
Fig A1
Fig A1
Correlation coefficients matrix of data noise among detector bins from repeated measurements of (a) the QA nearly-symmetric cylinder phantom, (c) the Shoulder asymmetric phantom at 3 o’clock position, and (e) the Shoulder asymmetric phantom at 12 o’clock position. Pictures (b), (d) and (f) show the horizontal profiles through the center of (a), (c) and (e) correspondingly. It can be observed that only the diagonal value is equal to 1 while off-diagonal values are close to zero.
Fig A2
Fig A2
Correlation coefficients matrix of data signal among projection views from the sinogram of the QA nearly-symmetric cylinder phantom (top left) and the asymmetric Shoulder phantom (top right). Bottom shows their horizontal profiles across their centers respectively. The wider range of non-negligible values on bottom left is due to the high symmetric property of the QA phantom, see Fig. 4. The sinogram of the QA phantom is almost uniform along the view direction. Therefore, the correlation coefficients between different views have a wider range of nonnegligible values. When the phantom becomes more asymmetric, such as the Shoulder phantom in Fig. 1, the sinogram becomes more non-uniform along the view direction and, therefore, the correlation coefficients between nearby views have a narrow range of non-negligible values, as shown on the bottom right.

References

    1. Linton OW, Fred A, Mettler FA. “National conference on dose reduction in CT, with an emphasis on pediatric patients”. American Journal of Roentgenology. 2003;181:321–329. - PubMed
    1. Lange K, Carson R. “EM reconstruction algorithms for emission and transmission tomography”. J Computer Assisted Tomography. 1984;8:306–316. - PubMed
    1. Elbakri IA, Fessler JA. “Efficient and accurate likelihood for iterative image reconstruction in X-ray computed tomography”. Proc SPIE Med Imaging. 2003;5032:1839–1850.
    1. Lu H, Li X, Hsiao IT, Liang Z. “Analytical noise treatment for low-dose CT projection data by penalized weighted least-squares smoothing in the K-L domain”. Proc SPIE Med Imaging. 2002;4682:146–152.
    1. Li T, Li X, Wang J, Wen J, Lu H, Hsieh J, Liang Z. “Nonlinear sinogram smoothing for low-dose X-ray CT”. IEEE Trans Nucl Science. 2004;51:2505–2513.

Publication types

MeSH terms