

Structure of Halothiobacillus neapolitanus carboxysomes by cryo-electron tomography
- PMID: 17028023
- PMCID: PMC1839851
- DOI: 10.1016/j.jmb.2006.09.024
Structure of Halothiobacillus neapolitanus carboxysomes by cryo-electron tomography
Abstract
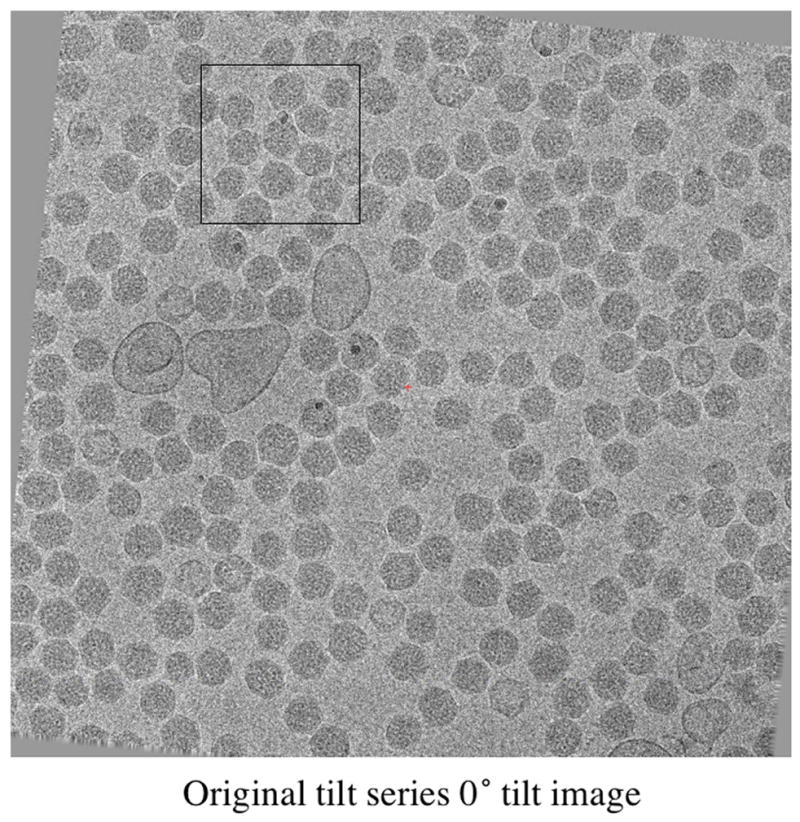
Carboxysomes are polyhedral bodies consisting of a proteinaceous shell filled with ribulose 1,5-bisphosphate carboxylase/oxygenase (RuBisCO). They are found in the cytoplasm of all cyanobacteria and some chemoautotrophic bacteria. Previous studies of Halothiobacillus neapolitanus and Nitrobacter agilis carboxysomes suggest that the structures are either icosahedral or dodecahedral. To determine the protein shell structure more definitively, purified H. neapolitanus carboxysomes were re-examined by cryo-electron tomography and scanning transmission electron microscopy (STEM). Due to the limited tilt angles in the electron microscope, the tomographic reconstructions are distorted. Corrections were made in the 3D orientation searching and averaging of the computationally extracted carboxysomes to minimize the missing data effects. It was found that H. neapolitanus carboxysomes vary widely in size and mass as shown by cryo-electron tomography and STEM mass measurements, respectively. We have aligned and averaged carboxysomes in several size classes from the 3D tomographic reconstruction by methods that are not model-biased. The averages reveal icosahedral symmetry of the shell, but not of the density inside it, for all the size classes.
Figures


Similar articles
-
Structure and assembly of cargo Rubisco in two native α-carboxysomes.Nat Commun. 2022 Jul 25;13(1):4299. doi: 10.1038/s41467-022-32004-w. Nat Commun. 2022. PMID: 35879301 Free PMC article.
-
Halothiobacillus neapolitanus carboxysomes sequester heterologous and chimeric RubisCO species.PLoS One. 2008;3(10):e3570. doi: 10.1371/journal.pone.0003570. Epub 2008 Oct 30. PLoS One. 2008. PMID: 18974784 Free PMC article.
-
Visualizing Individual RuBisCO and Its Assembly into Carboxysomes in Marine Cyanobacteria by Cryo-Electron Tomography.J Mol Biol. 2018 Oct 19;430(21):4156-4167. doi: 10.1016/j.jmb.2018.08.013. Epub 2018 Aug 20. J Mol Biol. 2018. PMID: 30138616 Free PMC article.
-
Comparative analysis of carboxysome shell proteins.Photosynth Res. 2011 Sep;109(1-3):21-32. doi: 10.1007/s11120-011-9624-6. Epub 2011 Jan 30. Photosynth Res. 2011. PMID: 21279737 Free PMC article. Review.
-
Cyanobacterial carboxysomes: microcompartments that facilitate CO2 fixation.J Mol Microbiol Biotechnol. 2013;23(4-5):300-7. doi: 10.1159/000351342. Epub 2013 Aug 5. J Mol Microbiol Biotechnol. 2013. PMID: 23920493 Review.
Cited by
-
Advances in Understanding Carboxysome Assembly in Prochlorococcus and Synechococcus Implicate CsoS2 as a Critical Component.Life (Basel). 2015 Mar 27;5(2):1141-71. doi: 10.3390/life5021141. Life (Basel). 2015. PMID: 25826651 Free PMC article.
-
A multiprotein bicarbonate dehydration complex essential to carboxysome function in cyanobacteria.J Bacteriol. 2008 Feb;190(3):936-45. doi: 10.1128/JB.01283-07. Epub 2007 Nov 9. J Bacteriol. 2008. PMID: 17993516 Free PMC article.
-
Cryo-electron tomography reveals the comparative three-dimensional architecture of Prochlorococcus, a globally important marine cyanobacterium.J Bacteriol. 2007 Jun;189(12):4485-93. doi: 10.1128/JB.01948-06. Epub 2007 Apr 20. J Bacteriol. 2007. PMID: 17449628 Free PMC article.
-
Structural analysis of CsoS1A and the protein shell of the Halothiobacillus neapolitanus carboxysome.PLoS Biol. 2007 Jun;5(6):e144. doi: 10.1371/journal.pbio.0050144. PLoS Biol. 2007. PMID: 17518518 Free PMC article.
-
Structure and assembly of cargo Rubisco in two native α-carboxysomes.Nat Commun. 2022 Jul 25;13(1):4299. doi: 10.1038/s41467-022-32004-w. Nat Commun. 2022. PMID: 35879301 Free PMC article.
References
-
- Shively JM, Ball F, Brown DH, Saunders RE. Functional organelles in prokaryotes: polyhedral inclusions (carboxysomes) of Thiobacillus neapolitanus. Science. 1973;182:584–6. - PubMed
-
- Cannon GC, Shively JM. Characterization of a homogenous preparation of carboxysomes from Thiobacillus neapolitanus. Arch Microbiol. 1983;134:52–59.
-
- Shively JM. Inclusion bodies of prokaryotes. Annual Review of Microbiology. 1974;28:167–87. - PubMed
-
- Codd GA, Marsden WJN. The carboxysomes (polyhedral bodies) of autotrophic prokaryotes. Biol Rev. 1984;59:389–422.
-
- Shively JM, English RS. The carboxysome, a prokaryotic organelle: a mini review. Can J Bot. 1991;69:957–962.
Publication types
MeSH terms
Substances
Grants and funding
LinkOut - more resources
Full Text Sources
