. 2007 Jan 1;92(1):330-42.
doi: 10.1529/biophysj.106.090969. Epub 2006 Oct 6.

Transport governs flow-enhanced cell tethering through L-selectin at threshold shear

Affiliations

Transport governs flow-enhanced cell tethering through L-selectin at threshold shear

Tadayuki Yago et al. Biophys J. .

Abstract

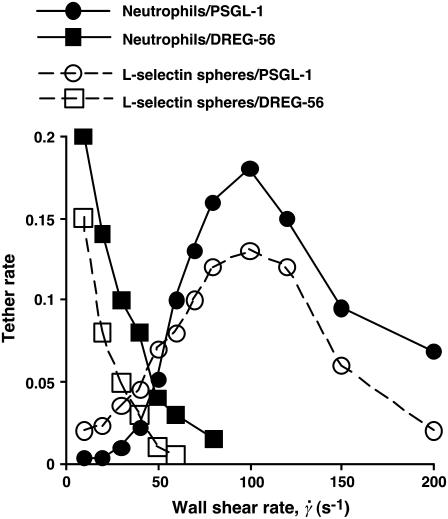
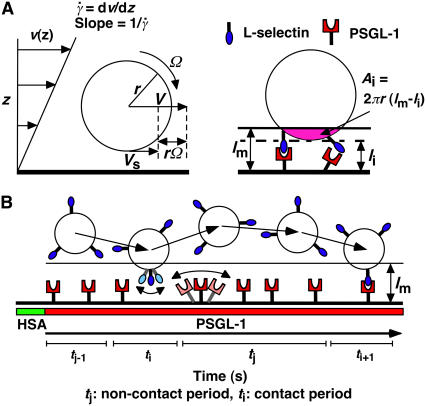
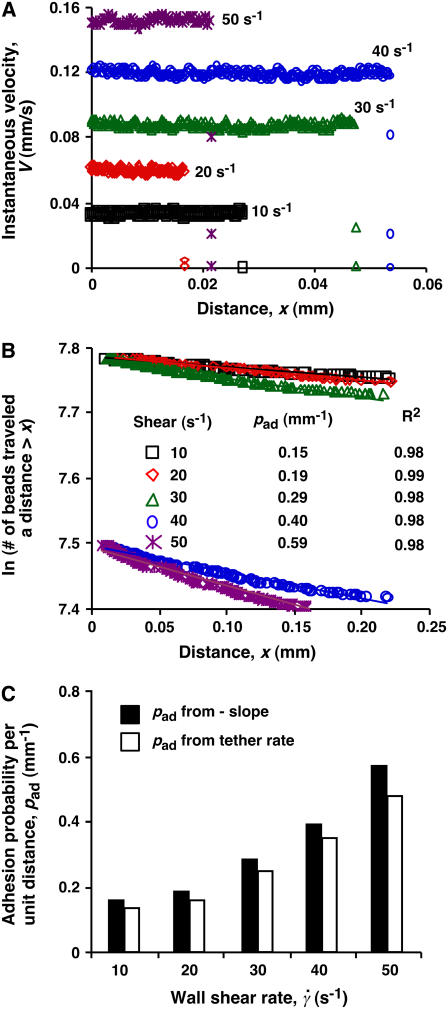
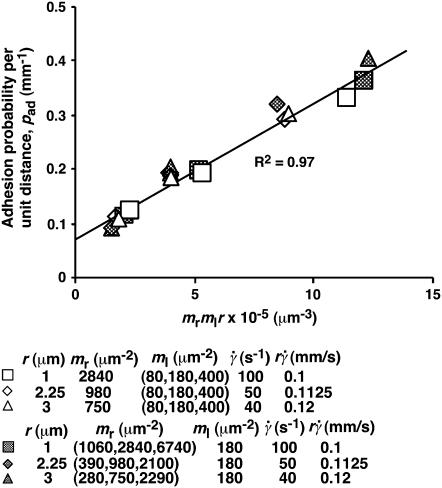
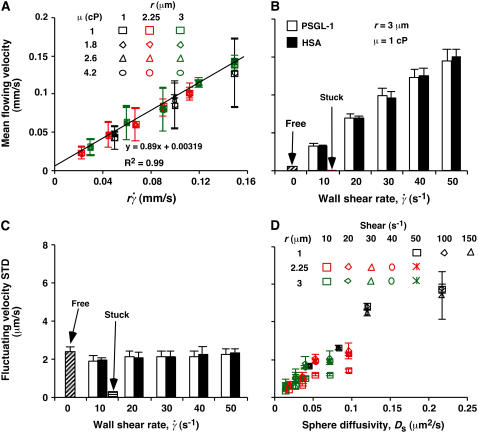
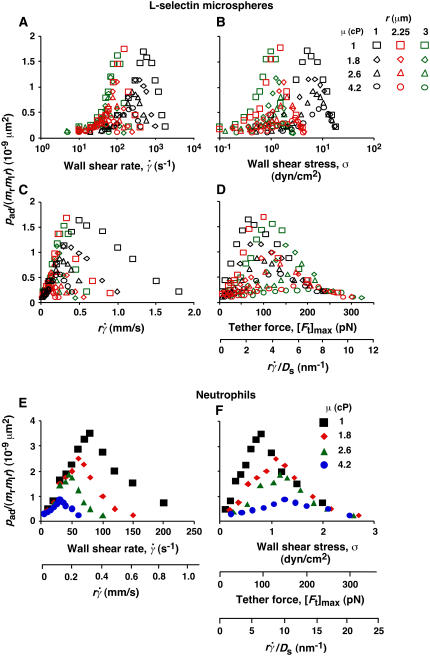
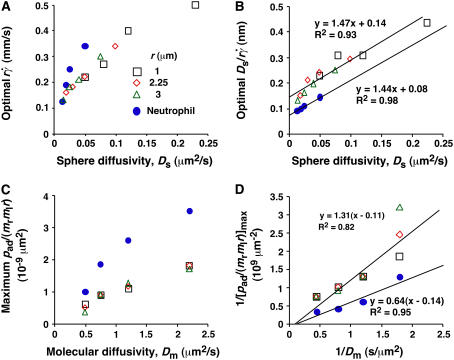
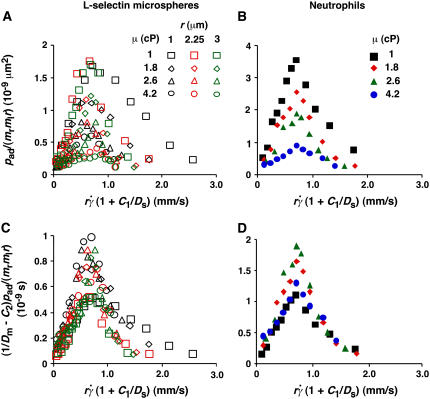
Flow-enhanced cell adhesion is a counterintuitive phenomenon that has been observed in several biological systems. Flow augments L-selectin-dependent adhesion by increasing the initial tethering of leukocytes to vascular surfaces and by strengthening their subsequent rolling interactions. Tethering or rolling might be influenced by physical factors that affect the formation or dissociation of selectin-ligand bonds. We recently demonstrated that flow enhanced rolling of L-selectin-bearing microspheres or neutrophils on P-selectin glycoprotein ligand-1 by force decreased bond dissociation. Here, we show that flow augmented tethering of these microspheres or cells to P-selectin glycoprotein ligand-1 by three transport mechanisms that increased bond formation: sliding of the sphere bottom on the surface, Brownian motion, and molecular diffusion. These results elucidate the mechanisms for flow-enhanced tethering through L-selectin.


Figures

FIGURE 1
FIGURE 1
Flow enhances tethering to an L-selectin ligand but not to an antibody. Neutrophils or L-selectin-bearing microspheres (3-μm radius) were perfused over immobilized PSGL-1 or anti-L-selectin mAb DREG-56 at various wall shear rates. The tethering rate was measured and normalized for cell or microsphere delivery.
FIGURE 2
FIGURE 2
Parameters of cell tethering under flow. (A) The fluid velocity v of a Couette flow field bordered with a solid surface (xy plane) is parallel to the surface and increases linearly with the distance from the surface (z direction). The shear rate formula image is reciprocal to the slope of the velocity profile. Fluid-mechanics theory predicts that the translational velocity V and angular velocity Ω of a sphere of radius r freely moving above a surface in an otherwise Couette flow are proportional to formula image and formula image, respectively (29). The sphere bottom has a positive velocity VsVrΩ ∝ formula image relative to the surface (13). The sphere and the surface are coated with receptors and ligands, respectively, whose combined length lm sets a contact threshold. When the gap distance li between the sphere bottom and the surface is <lm, the two are in contact with an area Ai = 2πr(lmli). (B) Due to its small size, the sphere is susceptible to thermal excitations that cause Brownian motion. This produces fluctuations in velocity components parallel to the surface, which can be directly observed (cf. Fig. 3 A), as well as those perpendicular to the surface, which are depicted by the wavy trajectory of the sphere shown at five different times and positions. By randomly modulating the gap distance above and below the contact threshold z = lm (horizontal line), Brownian motion causes discontinuous contacts of different portions of the sphere with different portions of the surface, with alternating intervals of contact (ti) and noncontact (tj). A productive contact results in a tethering event, but many contacts are nonproductive. As schematically shown for one receptor and one ligand by the movements along the two-sided arrows (lighter colors), the binding sites of L-selectin and PSGL-1 can undergo rotational diffusion even though portions of the molecules are anchored to the respective sphere surface and chamber floor. To ensure that only first-time tethering events were observed, the chamber floor upstream to the microscope field of view was coated with HSA to allow measurement of the distance traveled by the sphere from the demarcation line to the location where tethering occurs. The cell, contact area, and molecular sizes are not drawn to scale.
FIGURE 3
FIGURE 3
Measurement of adhesion probability per unit distance. (A) Instantaneous velocities of 3-μm-radius microspheres bearing L-selectin flowing parallel to a surface coated with PSGL-1 were measured at 500 fps for five wall shear rates (indicated) as functions of distance. Shown are representative velocities with observed tethering events, which occurred randomly. Many more spheres did not tether in the field of view. (B) Data from a large number of such measurements were plotted as ln(number of microspheres traveling a distance ≥x) versus x curves. For each of the five wall shear rates (indicated) tested, the data were well fitted by a straight line (see the R2 values for the goodness of fit). The adhesion probability per unit distance (pad) was evaluated from the negative slope of the linear fit to the data. (C) Comparison of pad evaluated from the negative slopes (solid bars) and those calculated from the tether-rate data using Eq. 6 (open bars).
FIGURE 4
FIGURE 4
Dependence of pad on receptors and ligands on the contact area. Rates of microspheres of indicated radii (r) bearing indicated L-selectin densities (mr) tethering to indicated PSGL-1 densities (ml) were measured at indicated shear rates (formula image) such that the formula image values were matched. The adhesion probability per distance, pad, was calculated from the TR data using Eq. 6 and plotted versus mlmrr. A straight line was fit to the data and the goodness of fit was indicated by the R2 value. Two sets of conditions were tested. In one set, ml was varied while the product mrr was kept constant, although different mr and r were used for different group of three ml levels (open symbols). In the other set, ml was kept constant whereas mr was varied for each of the three r levels (solid symbols).
FIGURE 5
FIGURE 5
Controlling parameters for sphere motions. Mean (A and B) and standard deviation (C and D) of velocities of L-selectin-bearing microspheres of different radii flowing in media of different viscosities at different wall shear rates over PSGL-1 or HSA. Instantaneous velocities were measured at 250 (A and D) or 500 (B and C) fps for 1 s for each microsphere, from which the mean and standard deviation of velocity were calculated for that microsphere. Data are presented as mean ± SD of 10 microspheres tested for each condition. (A) Linear relationship between mean flowing velocity and the product of the microsphere radius r and wall shear rate formula image, which identifies formula image as a controlling parameter for convective transport by mean sliding of the sphere bottom on the surface. (B and C) Comparison between mean (B) or standard deviation (C) of velocities of 3-μm-radius microspheres bearing L-selectin flowing in 1-cP media at 10–50 s−1 wall shear rates over PSGL-1 or HSA. Measurements were also made for microspheres stuck at the surface at 10 s−1 wall shear rate and for free microspheres at zero flow on HSA. (D) Positive correlation between the standard deviation of fluctuating velocity and the sphere diffusivity Ds, which identifies Ds as a controlling parameter for transport by Brownian motion. Each sphere radius and shear rate combination includes four data points for different media viscosities (1, 1.8, 2.6, and 4.2 cP).
FIGURE 6
FIGURE 6
Analysis of tether-rate curves. Adhesion probabilities per distance, pad, of L-selectin-bearing microspheres (AD) and neutrophils (E and F) were calculated from the tether rate data, normalized by mrmlr, and plotted versus wall shear rate formula image (A and E), wall shear stress σ = formula image (B and F), product formula image (C and E), and maximum tether force [Ft]max or formula image (D and F). Microspheres of three different radii and media of four different viscosities were used (indicated). The data were recorded at 250 fps.
FIGURE 7
FIGURE 7
Analysis of optimal values of tether-rate curves. (A) Peak locations of the pad/(mrmlr) versus formula image curves (optimal formula image) were plotted against the sphere diffusivity Ds. (B) Peak locations of the pad/(mrmlr) versus formula image curves (optimal Ds/formula image) were plotted against the sphere diffusivity Ds. (C) Maximum pad/(mrmlr) values were plotted against the molecular diffusivity Dm. (D) Reciprocal of maximum pad/(mrmlr) values were plotted against reciprocal of the molecular diffusivity. Positive correlations were evident in all plots for both microspheres (open symbols) and neutrophils (solid circles). A straight line was fit to each set of the data for microspheres or neutrophils in B and D. The best-fit equations are indicated along with the R2 values.
FIGURE 8
FIGURE 8
Collapse of multiple data curves by proper scaling of the contributions by three transport mechanisms. When the normalized adhesion probabilities per distance for microspheres (A) and neutrophils (B), pad/(mrmlr), were plotted versus formula image(1 + C1/Ds), a variable that combines sphere transport mechanisms for both relative sliding and Brownian motion, the ranges of all curves were aligned. When the pad/(mrmlr) values were further multiplied by (1/DmC2) to obtain a variable that combines molecular diffusion and molecular docking, all 12 microsphere curves collapsed into a single curve (C). Similarly, all four neutrophil curves collapsed into a single curve (D).
FIGURE 9
FIGURE 9
Dependence of adhesion probability per unit time on sliding velocity. kad/(mrmlr) was calculated from pad/(mrmlr) using Eq. 5 and the linear data between the average microsphere flowing velocity V and formula image (Fig. 5 A). Data for 3-μm microspheres flowing in 1-cP medium are shown, but curves converted from other pad/(mrmlr) data in Fig. 6 have a similar biphasic shape.

References

    1. Vestweber, D., and J. E. Blanks. 1999. Mechanisms that regulate the function of the selectins and their ligands. Physiol. Rev. 79:181–213. - PubMed
    1. McEver, R. P. 2001. Adhesive interactions of leukocytes, platelets, and the vessel wall during hemostasis and inflammation. Thromb. Haemost. 86:746–756. - PubMed
    1. McEver, R. P. 2002. Selectins: lectins that initiate cell adhesion under flow. Curr. Opin. Cell Biol. 14:581–586. - PubMed
    1. Finger, E. B., K. D. Puri, R. Alon, M. B. Lawrence, U. H. von Andrian, and T. A. Springer. 1996. Adhesion through L-selectin requires a threshold hydrodynamic shear. Nature. 379:266–269. - PubMed
    1. Lawrence, M. B., G. S. Kansas, E. J. Kunkel, and K. Ley. 1997. Threshold levels of fluid shear promote leukocyte adhesion through selectins (CD62L,P,E). J. Cell Biol. 136:717–727. - PMC - PubMed

Publication types