. 2006 Dec;174(4):2021-32.
doi: 10.1534/genetics.106.063628. Epub 2006 Oct 8.

Duplication of centromeric histone H3 (HTR12) gene in Arabidopsis halleri and A. lyrata, plant species with multiple centromeric satellite sequences

Affiliations

Duplication of centromeric histone H3 (HTR12) gene in Arabidopsis halleri and A. lyrata, plant species with multiple centromeric satellite sequences

Akira Kawabe et al. Genetics. 2006 Dec.

Abstract

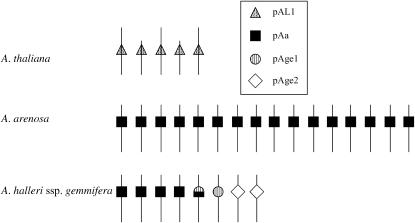
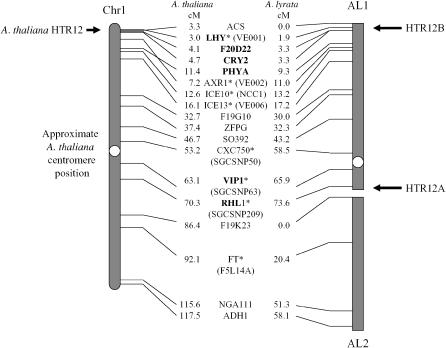
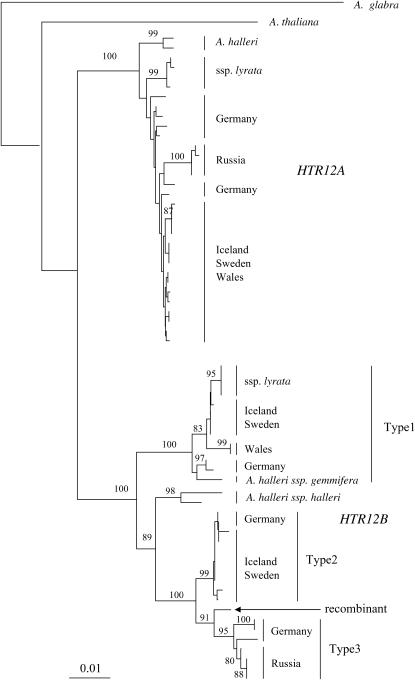
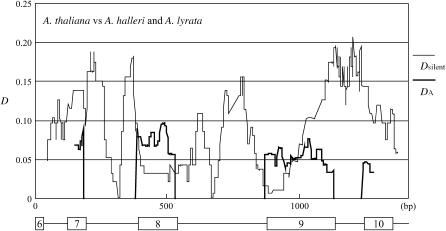
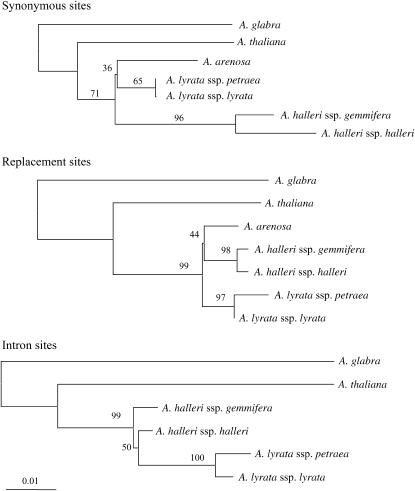
Arabidopsis halleri and lyrata have three different major centromeric satellite sequences, a unique finding for a diploid Arabidopsis species. Since centromeric histones coevolve with centromeric satellites, these proteins would be predicted to show signs of selection when new centromere satellites have recently arisen. We isolated centromeric protein genes from A. halleri and lyrata and found that one of them, HTR12 (CENP-A), is duplicated, while CENP-C is not. Phylogenetic analysis indicates that the HTR12 duplication occurred after these species diverged from A. thaliana. Genetic mapping shows that HTR12 copy B has the same genomic location as the A. thaliana gene; the other copy (A, at the other end of the same chromosome) is probably the new copy. To test for selection since the duplication, we surveyed diversity at both HTR12 loci within A. lyrata. Overall, there is no strong evidence for an "evolutionary arms race" causing multiple replacement substitutions. The A. lyrata HTR12B sequences fall into three classes of haplotypes, apparently maintained for a long time, but they all encode the same amino acid sequence. In contrast, HTR12A has low diversity, but many variants are amino acid replacements, possibly due to independent selective sweeps within populations of the species.


Figures

F<sc>igure</sc> 1.—
Figure 1.—
Schematic of the centromeric satellite sequence families of A. thaliana, A. arenosa, and A. halleri ssp. gemmifera (from Kamm et al. 1995 and Kawabe and Nasuda 2005). The centromere satellite families present on each individual chromosome have not yet been identified in A. halleri.
F<sc>igure</sc> 2.—
Figure 2.—
Genetic maps of A. thaliana chromosome 1 and the homologous A. lyrata linkage groups 1 and 2 (AL1 and -2), showing the map positions of the A. thaliana HTR12 gene and the duplicated HTR12 loci in A. lyrata ssp. petraea. The names of markers showing close linkage to the duplicated HTR12 loci in A. lyrata are in boldface type. Map positions of markers in the two species are centimorgan values in the A. thaliana recombinant inbred (RI) genetic map in the The Arabidopsis Information Resource database (http://www.arabidopsis.org/) and the A. lyrata map of Kuittinen et al. (2004). Seven markers in the A. lyrata map (indicated by asterisks after the marker names) correspond to markers that were not mapped in the A. thaliana RI genetic map. The homologous A. thaliana markers were assumed to be located close to the positions of mapped markers that are <100 kb away in the complete genome sequence. These marker names are shown in parentheses. More map details are described in Hansson et al. (2006).
F<sc>igure</sc> 3.—
Figure 3.—
Neighbor-joining tree based on the nucleotide differences between the HTR12 sequences, based on the entire region. Bootstrap values >80% are shown by the relevant nodes. A distance bar is shown below the trees.
F<sc>igure</sc> 4.—
Figure 4.—
Sliding-window analyses for the CENP-C gene. Sliding-window plot for divergence between A. thaliana and A. halleriA. lyrata is shown. The exon–intron structure is indicated below the plot. Divergence values are plotted in 1-bp steps in 50- and 100-bp windows for silent (thin line) and replacement (thick line) sites, respectively.
F<sc>igure</sc> 5.—
Figure 5.—
Neighbor-joining tree based on the nucleotide differences between the CENP-C sequences. Trees based on the synonymous sites, replacement sites, and intronic region are shown. Bootstrap values are shown by the relevant nodes. All trees have the same scale (see the distance bar below the trees).

References

    1. Chamary, J. V., J. L. Parmley and L. D. Hurst, 2006. Hearing silence: non-neutral evolution at synonymous sites in mammals. Nat. Rev. Genet. 7: 98–108. - PubMed
    1. Charlesworth, B., M. Nordborg and D. Charlesworth, 1997. The effects of local selection, balanced polymorphism and background selection on equilibrium patterns of genetic diversity in subdivided inbreeding and outcrossing populations. Genet. Res. 70: 155–174. - PubMed
    1. Cooper, J. L., and S. Henikoff, 2004. Adaptive evolution of the histone fold domain in centromeric histones. Mol. Biol. Evol. 21: 1712–1718. - PubMed
    1. Fay, J. C., and C.-I Wu, 2000. Hitchhiking under positive Darwinian selection. Genetics 155: 1405–1413. - PMC - PubMed
    1. Fu, Y.-X., 1997. Statistical tests of neutrality of mutations against population growth, hitchhiking and background selection. Genetics 147: 915–925. - PMC - PubMed