

The X chromosome in quantitative trait locus mapping
- PMID: 17028340
- PMCID: PMC1698653
- DOI: 10.1534/genetics.106.061176
The X chromosome in quantitative trait locus mapping
Abstract
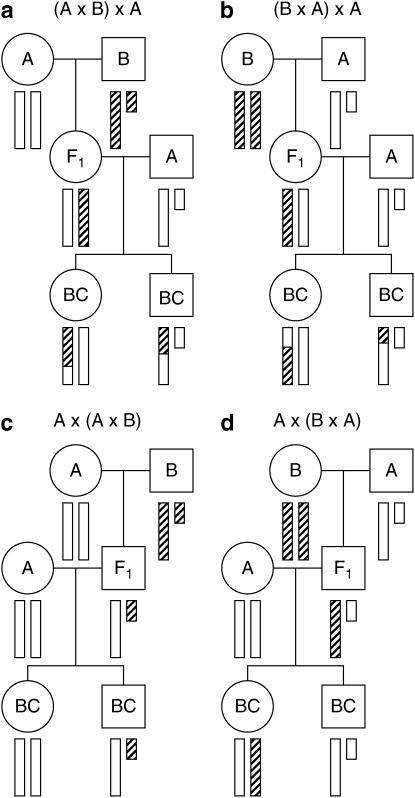
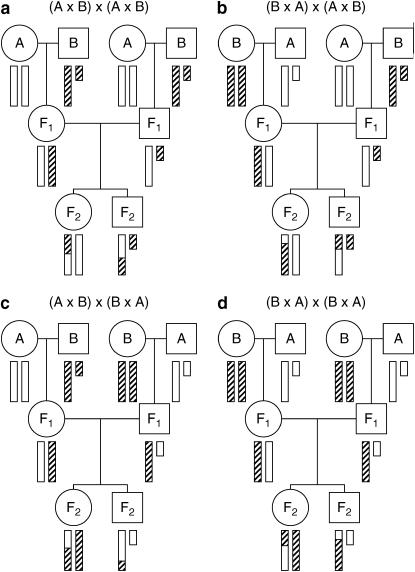
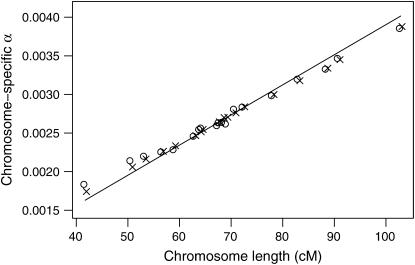
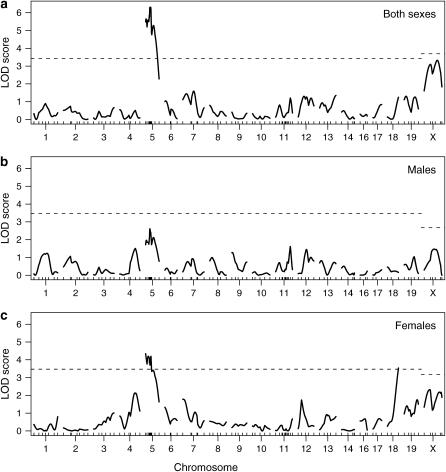
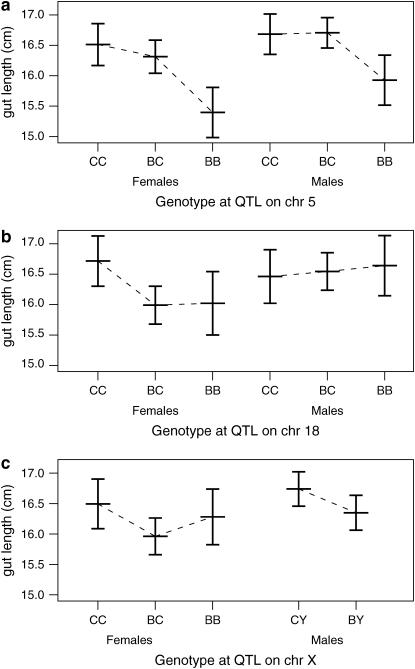
The X chromosome requires special treatment in the mapping of quantitative trait loci (QTL). However, most QTL mapping methods, and most computer programs for QTL mapping, have focused exclusively on autosomal loci. We describe a method for appropriate treatment of the X chromosome for QTL mapping in experimental crosses. We address the important issue of formulating the null hypothesis of no linkage appropriately. If the X chromosome is treated like an autosome, a sex difference in the phenotype can lead to spurious linkage on the X chromosome. Further, the number of degrees of freedom for the linkage test may be different for the X chromosome than for autosomes, and so an X chromosome-specific significance threshold is required. To address this issue, we propose a general procedure to obtain chromosome-specific significance thresholds that controls the genomewide false positive rate at the desired level. We apply our methods to data on gut length in a large intercross of mice carrying the Sox10Dom mutation, a model of Hirschsprung disease. We identified QTL contributing to variation in gut length on chromosomes 5 and 18. We found suggestive evidence of linkage to the X chromosome, which would be viewed as strong evidence of linkage if the X chromosome was treated as an autosome. Our methods have been implemented in the package R/qtl.
Figures
References
-
- Ahmadiyeh, N., G. A. Churchill, K. Shimomura, L. C. Solberg, J. S. Takahashi et al., 2003. X-linked and lineage-dependent inheritance of coping responses to stress. Mamm. Genome 14: 748–757. - PubMed
-
- Broman, K. W., H. Wu, Ś. Sen and G. A. Churchill, 2003. R/qtl: QTL mapping in experimental crosses. Bioinformatics 19: 889–890. - PubMed
-
- Dempster, A. P., N. M. Laird and D. B. Rubin, 1977. Maximum likelihood from incomplete data via the EM algorithm. J. R. Stat. Soc. B 39: 1–38.
-
- Haley, C. S., and S. A. Knott, 1992. A simple regression method for mapping quantitative trait loci in line crosses using flanking markers. Heredity 69: 315–324. - PubMed
Publication types
MeSH terms
Grants and funding
LinkOut - more resources
Full Text Sources
Molecular Biology Databases
