. 2006 Oct 6;2(10):e129.
doi: 10.1371/journal.pcbi.0020129. Epub 2006 Aug 17.

Simulating properties of in vitro epithelial cell morphogenesis

Affiliations

Simulating properties of in vitro epithelial cell morphogenesis

Mark R Grant et al. PLoS Comput Biol. .

Abstract

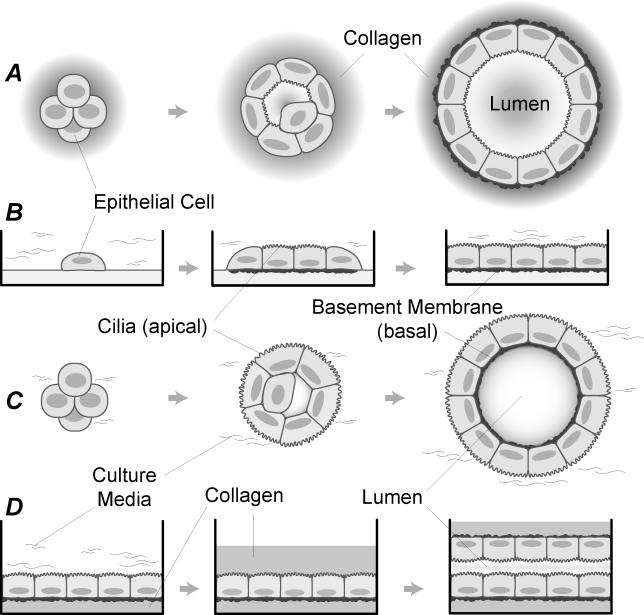
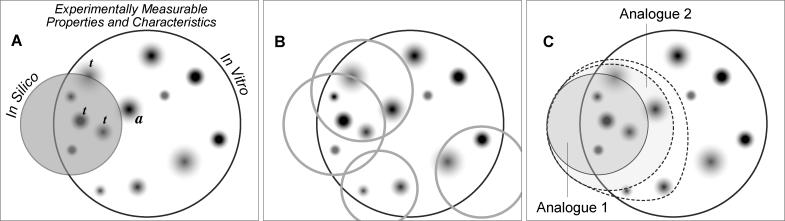
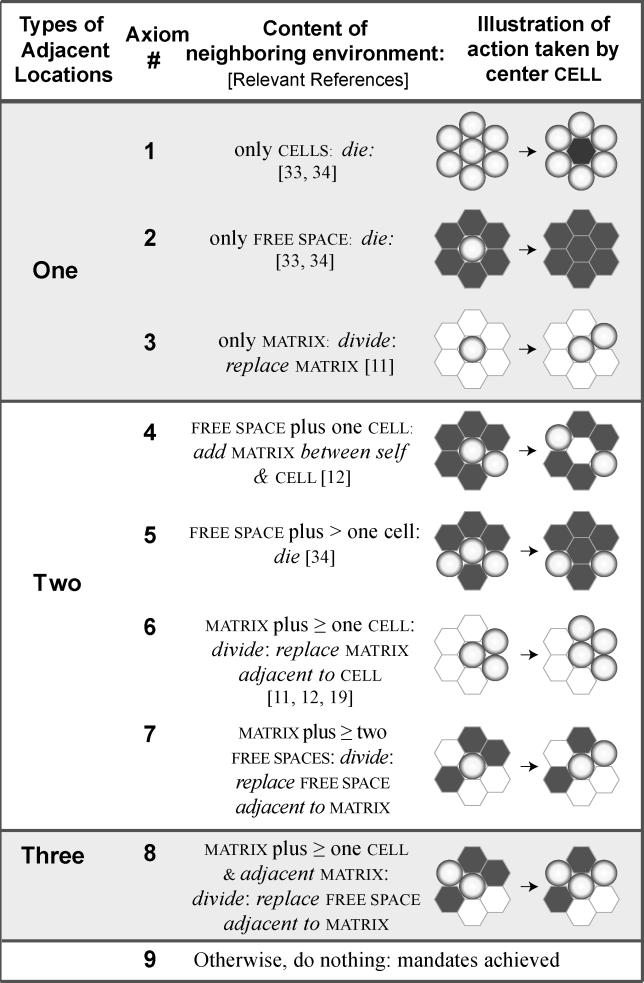
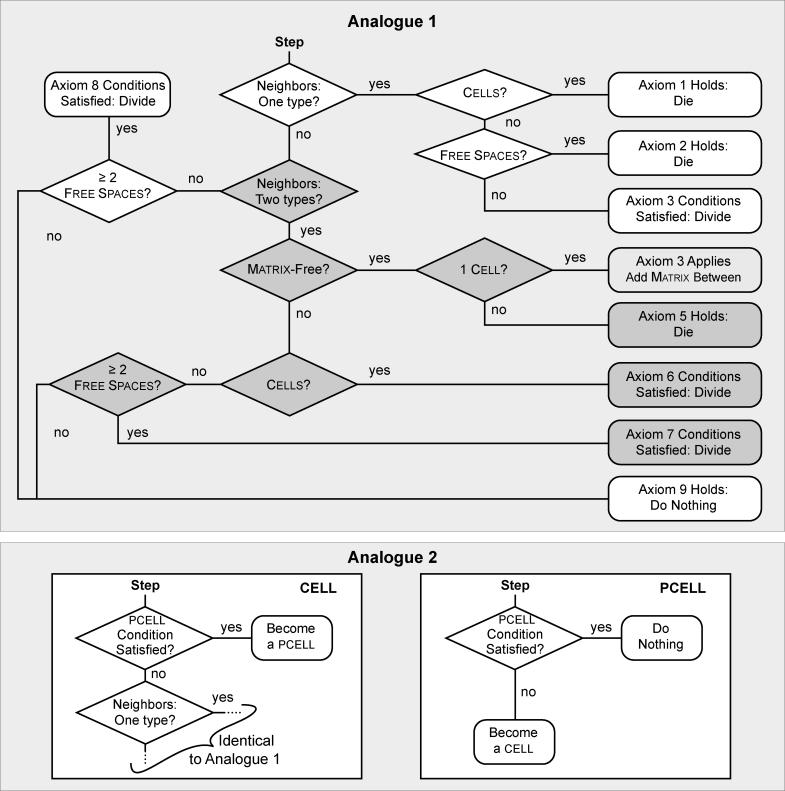
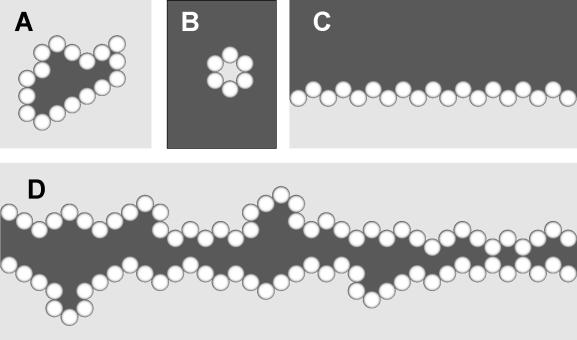
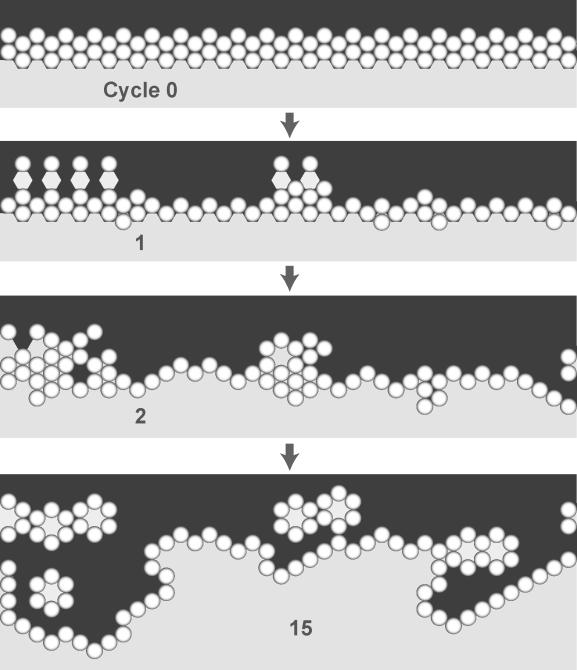
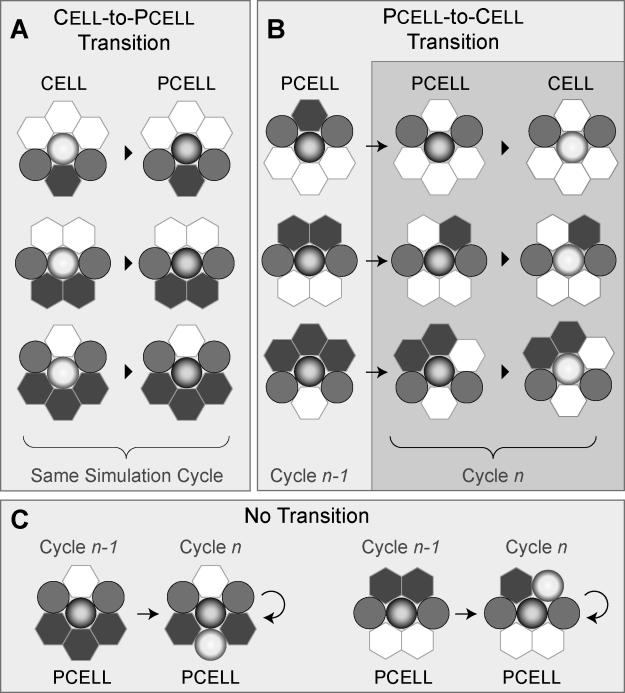
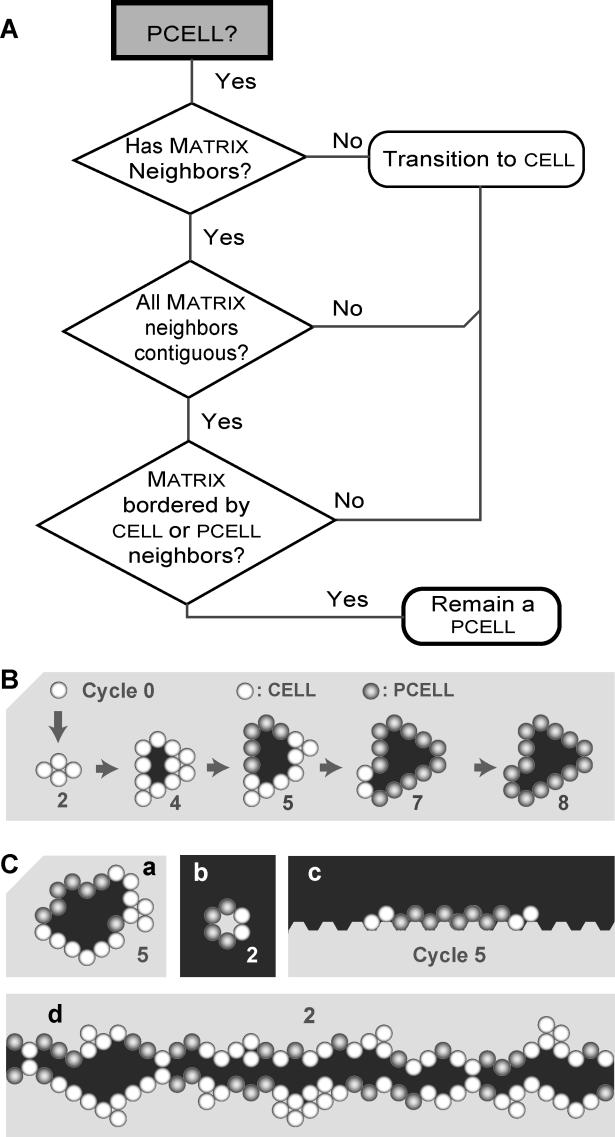
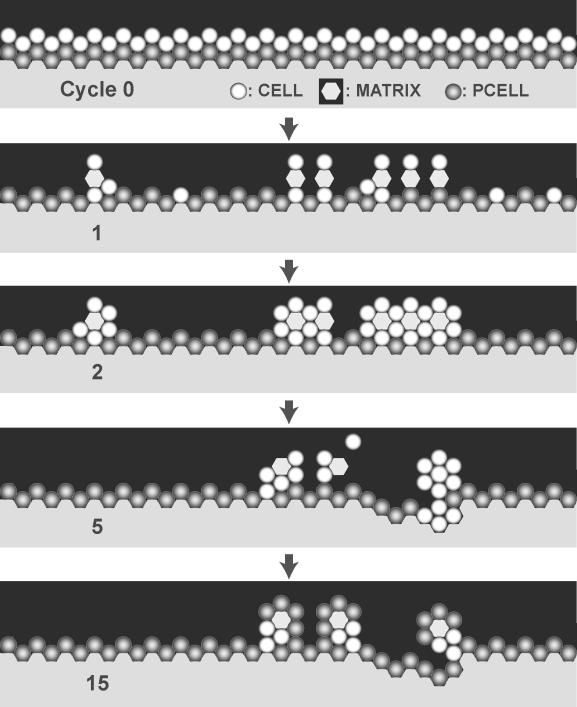
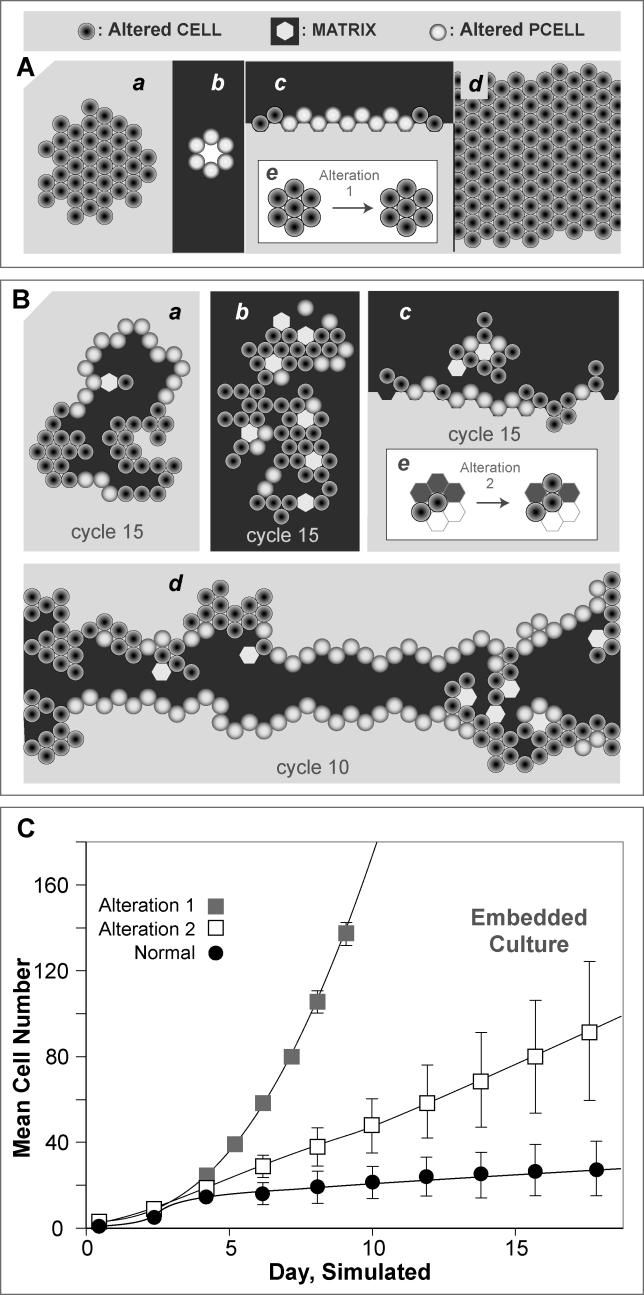
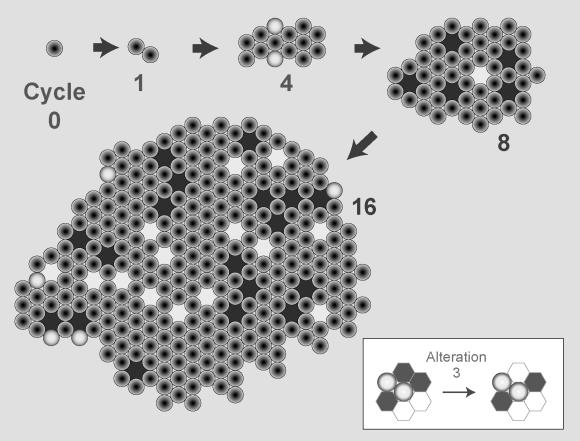
How do individual epithelial cells (ECs) organize into multicellular structures? ECs are studied in vitro to help answer that question. Characteristic growth features include stable cyst formation in embedded culture, inverted cyst formation in suspension culture, and lumen formation in overlay culture. Formation of these characteristic structures is believed to be a consequence of an intrinsic program of differentiation and de-differentiation. To help discover how such a program may function, we developed an in silico analogue in which space, events, and time are discretized. Software agents and objects represent cells and components of the environment. "Cells" act independently. The "program" governing their behavior is embedded within each in the form of axioms and an inflexible decisional process. Relationships between the axioms and recognized cell functions are specified. Interactions between "cells" and environment components during simulation give rise to a complex in silico phenotype characterized by context-dependent structures that mimic counterparts observed in four different in vitro culture conditions: a targeted set of in vitro phenotypic attributes was matched by in silico attributes. However, for a particular growth condition, the analogue failed to exhibit behaviors characteristic of functionally polarized ECs. We solved this problem by following an iterative refinement method that improved the first analogue and led to a second: it exhibited characteristic differentiation and growth properties in all simulated growth conditions. It is the first model to simultaneously provide a representation of nonpolarized and structurally polarized cell types, and a mechanism for their interconversion. The second analogue also uses an inflexible axiomatic program. When specific axioms are relaxed, growths strikingly characteristic of cancerous and precancerous lesions are observed. In one case, the simulated cause is aberrant matrix production. Analogue design facilitates gaining deeper insight into such phenomena by making it easy to replace low-resolution components with increasingly detailed and realistic components.


Conflict of interest statement

Competing interests. CAH is a Trustee of the CDH Research Foundation.

Figures

Figure 1
Figure 1. EC Growth Characteristics in Four Different In Vitro Culture Conditions (Cross-Section)
For each culture condition, development typically starts with one or several ECs. (A) Cell division, apoptosis, and shape change over a period of several days in embedded culture often leads to a stable, lumen-containing cyst formed by a single layer of ECs. (B) ECs plated on a layer of collagen (surface culture) typically generate a stable, uniform monolayer. (C) Inverted cysts (cell polarity relative to that in (A) is inverted) form in suspension culture, with matrix deposited on the inside of the cyst. (D) Lumens are frequently formed in collagen overlay experiments.
Figure 2
Figure 2. A Process for Iterative Refinement of Biological Models
An abstract Venn-like diagram illustrates the behavior similarities (depicted as overlapping sets of features) of in silico and in vitro models. (A) The shaded circle contains the set of observable, measurable attributes (qualities, properties, etc.) of an in silico model such as Analogue 1 or 2. The larger circle is the infinite set of possible observable, measurable attributes of an in vitro model that is being viewed or studied from a particular perspective, with attention focused on selected aspects of the system. a: Each small shaded domain represents the results of wet-lab experiments intended to measure a specific in vitro property or characteristic. The degree of shading illustrates different levels of experimental and measurement uncertainty. t: a member of the set of targeted in vitro attributes that the in silico model is expected to mimic. (B) This sketch illustrates that it may take many different in silico models, possibly drawn from different classes of models, to obtain even partial behavior coverage of the in vitro system. (C) Illustrated is the systematic, sequential extension of the in silico analogue's measurable attributes to improve coverage. The original shaded set can illustrate Analogue 1. The first dashed circle illustrates expanding the original set of targeted attributes by including one or more additional properties. The established analogue (Analogue 1) fails to generate the required outcomes, resulting in its invalidation. A copy of the established analogue can be iteratively refined (without losing or breaking the original behaviors) by adding new details as needed. The goal is to have all of the expanded set of targeted attributes (original plus expanded coverage) adequately represented by a new analogue, such as Analogue 2, represented by the first dashed circle. The process can be repeated indefinitely by adding attributes to the target set and then adding new capabilities to Analogue 2 as before. With each extension, the goal is to have the expanded set of targeted attributes all adequately represented. If the goal cannot be achieved without “breaking” the original model, then either a new model or multiple separate models, as in (B), may be required.
Figure 3
Figure 3. Axioms Developed from In Vitro Observations of EC Behavior in Different Culture Conditions
They specify the action a cell will take given a precondition: the composition and relative arrangement of components in its local neighborhood, directly adjacent to the cell. The neighborhood can contain one, two, or three types of object (cell, matrix, and free space). Black grid spaces represent free space; circular, shaded spheres represent cells; and white grid spaces represent matrix. When multiple neighborhood arrangements meet the requirements for placement of a daughter cell, one is selected at random. If a particular environment configuration does not meet one of the listed conditions for division or death, the cell does nothing.
Figure 4
Figure 4. The Flow of Decisionmaking—Axiom Application—by Each Cell During Simulation
During each simulation cycle, each cell has an option to act (the order of selection is randomized each cycle). For Analogue 1 the basic options are die, divide, move, and add matrix, or do nothing. Analogue 2 (lower boxes) provides three additional options: transition to pcell, remain a pcell, or transition to cell status. When its turn arrives, the cell assesses the status of its local neighborhood (types of components and their relative locations). That information establishes the precondition for axiom application. The diagram abstracts up from many different particular simulation runs of the analogue and represents possible chains of inference that any one cell may follow in any given simulation cycle. For each precondition, one axiom applies and one action results. During the next simulation cycle, the process repeats, independent of what occurred in any prior cycle.
Figure 5
Figure 5. Examples of Analogue 1 Outcomes in Four Simulated Environments
Spheres represent cells; black space represents free space or a simulated lumen space; a light shaded space represents matrix. (A) Stable cysts formed in simulated embedded culture. (B) A stable, inverted cyst formed in simulated suspension culture. (C) A stable monolayer formed in simulated surface culture. (D) A stable lumen formed in simulated overlay culture.
Figure 6
Figure 6. An Invalid Response from Analogue 1
The sketched screenshots show the induced growth response of a monolayer of cells in simulated surface culture following placement of a second layer of cells above the first. A black space represents free space or a simulated lumen space; a light shaded space represents matrix. All the cells in a stable monolayer in vitro are polarized and so are expected to be relatively unresponsive to the newly added cells. First, a stable monolayer of cells was formed. The simulation was stopped. A layer of cells was placed on top of the monolayer (top: cycle 0). The simulation was restarted. End of cycle 1: many of the added cells have “died;” growth and development of cells in the original monolayer have been stimulated; encroachment of cells into the matrix below has started. Cycle 2: remodeling is under way. Cycle 15: after considerable remodeling, a stable structure along with several inverted cysts has formed.
Figure 7
Figure 7. Analogue 2: Preconditions Determining Transitions between Cell and Pcell, or Lack Thereof
The decisional sequences followed during simulation are illustrated in Figures 4 and 8. (A) During a simulation cycle each cell assesses its neighborhood and consults the axioms to determine if it qualifies to become a pcell (Figure 4, lower left). Any one of the three arrangements shown qualifies. If qualified, the transition occurs immediately and it enters the next simulation cycle as a pcell. (B) During a simulation cycle each pcell (that was a pcell in the preceding simulation cycle) assesses its neighborhood and consults the axioms to determine if it qualifies to stay a pcell (Figure 4, lower right). The three arrangements shown (middle column) do not qualify. If not qualified (to remain a pcell), the transition to cell occurs immediately. (C) Illustrated are changes to a pcell's local neighborhood that do not meet any of the preconditions for a pcell-to-cell transition; it remains a pcell.
Figure 8
Figure 8. Retention of Pcell Status
(A) Given a pcell precondition, if three conditions in sequence are also met, as illustrated by the decisional flow diagram, then pcell status is retained. Otherwise, the pcell transitions to cell. (B) Sketched are sequential screen shots taken during a typical Analogue 2 simulation for simulated embedded culture. Spheres represent cells and pcells; pcells are shaded darker. A black space represents free space or a simulated lumen space; a light shaded space represents matrix. The first evidence of pcells is at the end of simulation cycle 5. Cycle 8: a stable structure has formed; only pcells are present. (C) An example of an Analogue 2 outcome from each of the four simulated environments, comparable to the Analogue 1 outcome in Figure 5. The status of the developing structures in the four simulated environments at simulation cycle 2 or 5 is shown. Each contains a mixture of cells and pcells: a: a developing cyst in simulated embedded culture; b: a cyst in simulated suspension culture; c: monolayer formation in simulated surface culture; and d: lumen formation in simulated overlay culture.
Figure 9
Figure 9. An Appropriate Response by Analogue 2
An appropriate response is demonstrated by Analogue 2 in the previously invalidating experiment described in Figure 6. This experiment determined that inclusion of pcells in Analogue 2 provides some resistance to the unacceptable, dramatic behavior of Analogue 1. Sketched are screen shots taken during a typical simulation. Pcells are shaded darker than cells. Spaces are shaded as defined in Figure 8. First, a stable monolayer of pcells was formed. The simulation was stopped. A layer of cells was placed on top of the pcell monolayer (top: cycle 0). The simulation was restarted. End of cycle 1: many of the added cells have “died,” and a few of the original pcells have transitioned to cell status. Cycle 5: some minor remodeling of the original layer of matrix has occurred; compare with cycle 2 in Figure 6. Cycle 15: a stable structure has formed dominated by pcells; some inverted cysts remain above the pcell monolayer.
Figure 10
Figure 10. Analogue 2: Comparisons of In Silico and In Vitro Results
Comparisons are presented of data from experiments in silico (n = 50), using Analogue 2, and in vitro data. A mean cell division time of 12.0 h is assumed. (A) Cell numbers per cyst in simulated embedded culture. In vitro cell number per cyst data was adapted from the cyst size time series in embedded culture provided in Figure 9 in [7], assuming an EC diameter of 10 μm and spherical hollow cysts. The bars indicate one standard error of the mean. (B) Average division event and death event counts at each simulation cycle. (C) The frequency distribution of cell numbers in vitro per cyst cross section after ten days in embedded culture are compared withthe frequency distribution of cell numbers per cyst cross section after 12 simulation cycles; black bars: simulation results; white bars: in vitro measurements. The former (in vitro) dataset was obtained by measuring MDCK cyst sizes at day 10 from Figure 2A in [24] (n = 44), assuming an EC diameter of 10 μm and spherical hollow cysts. The latter dataset was the result of n = 1,000 simulations. The insert shows the box plots for both datasets. The box centerline designates the median; the box designates the first through third quartiles; and the whiskers represent the 10% and 90% quantiles.
Figure 11
Figure 11. Consequence of Altering Two Axioms, 1 and 5
Growth characteristics that are a consequence of altering two axioms (1 and 5) controlling death and division are illustrated for four simulated culture conditions. As shown at the top in (A) and (B), cells have different shading than they do in Figures 8 and 9 because their behaviors are governed by a different set of axioms. Spaces are shaded as defined in Figure 8. The behavior of a pcell, when formed, was not influenced by the altered axioms. (A) Growth resulting from blocking cell death in Axioms 1 and 5 (Alteration 1). (B) Growth resulting from a simulated loss on an aspect of polarity caused by disrupting the directional cell placement in Axioms 7 and 8 so that daughter cells would be placed in any free space (Alteration 2). In both (A) and (B) the simulated growth conditions are as follows; a: simulated embedded culture; b: simulated suspension culture; c: simulated surface culture; and d: simulated overlay culture. In both (A) and (B) an example of altered axioms is provided by the insert e. (C) Cell and pcell growth is plotted for simulations in embedded culture that use either the normal axioms (Figures 3 and 7) or follow Alteration 1 or 2. The vertical bars are ± one standard deviation for 50 independent simulations.
Figure 12
Figure 12. Consequences of Altered Matrix Production
Altered matrix production causes loss of growth control in simulated culture conditions. Axioms 4 and 5 were replaced with a new one (an example of which is shown in the insert) that allowed for de novo matrix production in any environment consisting of free space and cell neighbors (Alteration 3). This sequence of illustrations of typical simulation outcomes shows the consequences of Alteration 3 on cyst formation in simulated embedded culture. The behavior of a pcell, when formed, was not influenced by the altered axiom, only the behavior of cells. As in Figure 11, cell shading is different to identify that an altered axiom set was used. Spaces are shaded as defined in Figure 8. At simulation cycle 0 a cell is added to a matrix-filled grid. At the conclusion of cycle 4, a small cluster had formed containing two pcells. By cycle 8 a distinct pattern of unstable growth was evident, with matrix- and free space–containing, lumen-like spaces within clusters of cells. That trend was still evident at cycle 16; the outer edge contained a few pcells. Thereafter, there was no growth.

References

    1. O'Brien LE, Zegers MM, Mostov KE. Opinion: Building epithelial architecture: Insights from three-dimensional culture models. Nat Rev Mol Cell Biol. 2002;3:531–537. - PubMed
    1. Galle J, Loeffler M, Drasdo D. Modeling the effect of deregulated proliferation and apoptosis on the growth dynamics of epithelial cell populations in vitro. Biophys J. 2005;88:62–75. - PMC - PubMed
    1. Walker DC, Hill G, Wood SM, Smallwood RH, Southgate J. Agent-based computational modeling of wounded epithelial cell monolayers. IEEE Trans Nanobioscience. 2004;3:153–163. - PubMed
    1. Brenner S. Biological computation. In: Bock GR, editor. The limits of reductionism in biology. Chichester (United Kingdom): Wiley; 1998. pp. 106–116.
    1. Noble D. The future: Putting Humpty-Dumpty together again. Biochem Soc Trans. 2003;31:156–158. - PubMed

Publication types