

Regulation of alpha-synuclein expression in alcohol-preferring and -non preferring rats
- PMID: 17029600
- PMCID: PMC4455882
- DOI: 10.1111/j.1471-4159.2006.04111.x
Regulation of alpha-synuclein expression in alcohol-preferring and -non preferring rats
Abstract
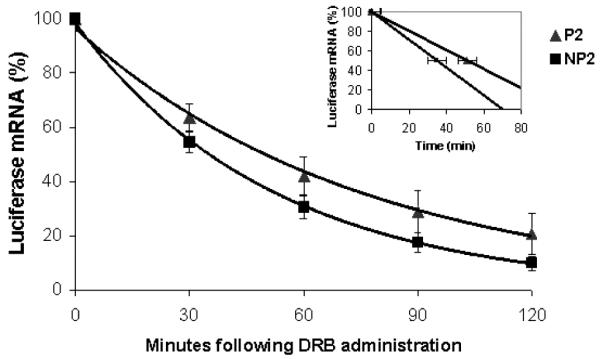
The alpha-synuclein (Snca) gene is expressed at higher levels in alcohol-naïve, inbred alcohol-preferring (iP) rats than in alcohol-non preferring (iNP) rats. Snca modulates dopamine transmission and the dopamineregic system, which play a role in mediating the rewarding properties of alcohol consumption. Thus, understanding regulation of Snca gene expression could provide insight into the relationship of Snca and alcohol consumption. To study regulation of rat Snca expression, 1,912 bp of the iP and iNP 5'-regions were cloned and sequenced. 5'-rapid amplification of cDNA ends (RACE), primer extension and RT-PCR mapped three transcription start site clusters (clusters TSS1, TSS2 and TSS3), suggesting that the Snca proximal promoter region has a complex architecture. This proximal promoter region has three TATA-less core promoters containing SP1 binding sites, initiator elements and downstream core promoter elements, which are often located in such promoters. Snca-luc constructs transiently transfected into SK-N-SH neuroblastoma cells showed that the region from - 1,912 to - 1,746 contained a strong core promoter, and that the entire approximately 2 kb region had significant promoter activity. Five polymorphisms identified between the iP and iNP in the proximal promoter region did not influence differential expression between the strains. In contrast, a single nucleotide polymorphism (SNP) at + 679 in the 3'-untranslated region (UTR) resulted in a 1.3-fold longer half-life of iP mRNA compared with iNP mRNA, which is consistent with the differential expression observed between the iP and iNP strains. These results suggest that regulation of rat Snca gene expression is complex and may contribute to alcohol preference in the iP rats.
Figures


Similar articles
-
alpha-Synuclein maps to a quantitative trait locus for alcohol preference and is differentially expressed in alcohol-preferring and -nonpreferring rats.Proc Natl Acad Sci U S A. 2003 Apr 15;100(8):4690-5. doi: 10.1073/pnas.0737182100. Epub 2003 Mar 28. Proc Natl Acad Sci U S A. 2003. PMID: 12665621 Free PMC article.
-
Expression of alpha-synuclein is increased in the hippocampus of rats with high levels of innate anxiety.Mol Psychiatry. 2009 Sep;14(9):894-905. doi: 10.1038/mp.2008.43. Epub 2008 Apr 22. Mol Psychiatry. 2009. PMID: 18427558
-
Five mutations in the GABA A alpha6 gene 5' flanking region are associated with a reduced basal and ethanol-induced alpha6 upregulation in mutated Sardinian alcohol non-preferring rats.Brain Res Mol Brain Res. 2005 Jun 13;137(1-2):252-7. doi: 10.1016/j.molbrainres.2004.07.024. Epub 2005 Apr 18. Brain Res Mol Brain Res. 2005. PMID: 15950783
-
The urocortin 1 neurocircuit: ethanol-sensitivity and potential involvement in alcohol consumption.Brain Res Rev. 2006 Sep;52(2):368-80. doi: 10.1016/j.brainresrev.2006.04.007. Brain Res Rev. 2006. PMID: 16766036 Review.
-
[Inheritance mechnisam of gene SNCA for alcohol dependence].Yi Chuan. 2010 Nov;32(11):1114-8. Yi Chuan. 2010. PMID: 21513161 Review. Chinese.
Cited by
-
Alpha sinuclein expression in blood and its relationship with chronic constipation in a population from Bogotá, D.C., with problems of alcohol consumption.Biomedica. 2020 Jun 15;40(2):309-321. doi: 10.7705/biomedica.4771. Biomedica. 2020. PMID: 32673459 Free PMC article. English, Spanish.
-
Alpha-synuclein, alcohol use disorders, and Parkinson disease: a case-control study.Parkinsonism Relat Disord. 2009 Jul;15(6):430-4. doi: 10.1016/j.parkreldis.2008.11.011. Epub 2009 Feb 4. Parkinsonism Relat Disord. 2009. PMID: 19196539 Free PMC article.
-
Alpha-Synuclein in Alcohol Use Disorder, Connections with Parkinson's Disease and Potential Therapeutic Role of 5' Untranslated Region-Directed Small Molecules.Biomolecules. 2020 Oct 21;10(10):1465. doi: 10.3390/biom10101465. Biomolecules. 2020. PMID: 33096655 Free PMC article. Review.
-
In vivo imaging of alpha-synuclein in mouse cortex demonstrates stable expression and differential subcellular compartment mobility.PLoS One. 2010 May 11;5(5):e10589. doi: 10.1371/journal.pone.0010589. PLoS One. 2010. PMID: 20485674 Free PMC article.
-
Estrogen-Dependent Upregulation of Adcyap1r1 Expression in Nucleus Accumbens Is Associated With Genetic Predisposition of Sex-Specific QTL for Alcohol Consumption on Rat Chromosome 4.Front Genet. 2018 Dec 4;9:513. doi: 10.3389/fgene.2018.00513. eCollection 2018. Front Genet. 2018. PMID: 30564267 Free PMC article.
References
-
- Bice P, Foroud T, Bo R, Castelluccio P, Lumeng L, Li TK, Carr LG. Genomic screen for QTLs underlying alcohol consumption in the P and NP rat lines. Mamm. Genome. 1998;9:949–955. - PubMed
-
- Bonsch D, Reulbach U, Bayerlein K, Hillemacher T, Kornhuber J, Bleich S. Elevated alpha synuclein mRNA levels are associated with craving in patients with alcoholism. Biol. Psychiatry. 2004;56:984–986. - PubMed
-
- Bonsch D, Greifenberg V, Bayerlein K, Biermann T, Reulbach U, Hillemacher T, Kornhuber J, Bleich S. Alpha-synuclein protein levels are increased in alcoholic patients and are linked to craving. Alcohol Clin. Exp. Res. 2005a;29:763–765. - PubMed
-
- Bonsch D, Lederer T, Reulbach U, Hothorn T, Kornhuber J, Bleich S. Joint analysis of the NACP-REP1 marker within the alpha synuclein gene concludes association with alcohol dependence. Hum. Mol. Genet. 2005b;14:967–971. - PubMed
-
- Breathnach R, Chambon P. Organization and expression of eucaryotic split genes coding for proteins. Annu. Rev. Biochem. 1981;50:349–383. - PubMed
Publication types
MeSH terms
Substances
Grants and funding
LinkOut - more resources
Full Text Sources
Other Literature Sources
Medical
Miscellaneous
