. 2006 Dec;26(24):9517-32.
doi: 10.1128/MCB.01145-06. Epub 2006 Oct 9.

Perk-dependent translational regulation promotes tumor cell adaptation and angiogenesis in response to hypoxic stress

Affiliations

Perk-dependent translational regulation promotes tumor cell adaptation and angiogenesis in response to hypoxic stress

Jaime D Blais et al. Mol Cell Biol. 2006 Dec.

Abstract

It has been well established that the tumor microenvironment can promote tumor cell adaptation and survival. However, the mechanisms that influence malignant progression have not been clearly elucidated. We have previously demonstrated that cells cultured under hypoxic/anoxic conditions and transformed cells in hypoxic areas of tumors activate a translational control program known as the integrated stress response (ISR). Here, we show that tumors derived from K-Ras-transformed Perk(-/-) mouse embryonic fibroblasts (MEFs) are smaller and exhibit less angiogenesis than tumors with an intact ISR. Furthermore, Perk promotes a tumor microenvironment that favors the formation of functional microvessels. These observations were corroborated by a microarray analysis of polysome-bound RNA in aerobic and hypoxic Perk(+/+) and Perk(-/-) MEFs. This analysis revealed that a subset of proangiogenic transcripts is preferentially translated in a Perk-dependent manner; these transcripts include VCIP, an adhesion molecule that promotes cellular adhesion, integrin binding, and capillary morphogenesis. Taken with the concomitant Perk-dependent translational induction of additional proangiogenic genes identified by our microarray analysis, this study suggests that Perk plays a role in tumor cell adaptation to hypoxic stress by regulating the translation of angiogenic factors necessary for the development of functional microvessels and further supports the contention that the Perk pathway could be an attractive target for novel antitumor modalities.


Figures

FIG. 1.
FIG. 1.
Perk affects tumor growth and angiogenesis in vivo. (A) Middle frame, representative nude mouse injected with Perk+/+ K-Ras MEFs (left flank) and Perk−/− K-Ras MEFs (right flank) with 5 × 10⁵ cells/site, at sacrifice. The dissected tumors are displayed below. Left and right frames, photographs of Perk+/+ (left) and Perk−/− (right) tumors during dissection. Note the number of vessels migrating towards the Perk+/+ tumor compared to the Perk−/− tumor. (B) Final tumor volumes (cm3) from seven animals at sacrifice, 23 to 41 days following subcutaneous inoculation of tumor cells (means ± standard errors of the means [SEM]). (C) Growth rates of K-Ras-transformed Perk+/+ and Perk−/− MEFs in vitro (n = 3). (D) Two representative photographs from nude mice at sacrifice following a subcutaneous injection of 5 × 10⁵ K-Ras-transformed Perk+/+ (left) or Perk−/− MEFs (right). Note the hemorrhagic pocket surrounding the Perk−/− tumors. Upon dissection, tumors within these blood-filled pockets remained small, pale nodules.
FIG. 2.
FIG. 2.
Perk affects microvessel formation in vivo. (A) Paraffin-embedded AP-stained sponges were sectioned (4 μm), eosin counterstained, and visualized by light microscopy. Top panels, representative pictures from Perk+/+ and AP-HDMEC-inoculated Matrigel/sponge implants. Bottom panels, representative pictures from Perk−/− and AP-HDMEC-inoculated Matrigel/sponge implants. Black arrows indicate AP-expressing functional vessels so designated by the presence of red blood cells within the vessel. Black arrowheads demonstrate nonfunctional vessels so designated by the cuboidal shape of the AP-expressing endothelial cells. Green arrows indicate hemorrhagic red blood cell infiltration. All pictures were taken at ×40 magnification. (B) The number of functional and nonfunctional vessels per section was quantified by visualization under ×40 magnification with a light microscope. The bars represent the means ± SEM from three Perk+/+- and four Perk−/−-containing sponges measured from three serial sections.
FIG. 3.
FIG. 3.
Translational inhibition in response to hypoxic stress is reduced in Perk−/− MEFs. Polysome profiles (absorbance at 254 nm) in cell lysates fractionated by sucrose density ultracentrifugation. SV40-immortalized Perk+/+ and Perk−/− cells were exposed to hypoxic stress for 4 h or left untreated (0 h). Cells were treated with cycloheximide (100 μg/ml) (37°C, 3 min) and lysed in a Triton X-100 buffer (4°C). Cell lysates were layered on a 10-ml continuous sucrose gradient (10 to 50%) and ultracentrifuged in an SW-41 rotor 39K for 90 min. The positions of the polysomes and ribosomal subunits are indicated. The increase in monosome-bound transcripts and ribosomal subunits, combined with the decrease in polysomes apparent in the hypoxia-treated cells, is indicative of decreased protein translation.
FIG. 4.
FIG. 4.
VCIP mRNA is more efficiently translated during hypoxia in Perk+/+ cells. (A) Total mRNA expression is unaffected by hypoxia. Total RNA was isolated prior to sucrose gradient fractionation from hypoxia-treated (4 h) or normoxic (0 h) SV40-immortalized Perk+/+ and Perk−/− cells, reverse transcribed, and quantified by real-time PCR. The quantities of each transcript are described as the number of transcripts isolated per microgram of total RNA. Each sample was independently normalized to a spiked internal control. Q-PCR analysis was replicated in triplicate. Results are representative of the averages ± SEM for three independent experiments. (B) VCIP transcripts are enriched in the polysomes of Perk+/+ cells during hypoxia. High-molecular-weight polysomes from hypoxia-treated (4 h) or normoxic (0 h) SV40-immortalized Perk+/+ and Perk−/− cells were pooled (fractions 6 to 10), reverse transcribed, and quantified by real-time PCR. The quantities of each transcript are described as the number of transcripts isolated per microgram of polysomal RNA. Each sample was independently normalized to a spiked internal control. Q-PCR analysis was repeated in triplicate. Results are representative of the averages ± SEM for three independent experiments. (C) Perk+/+ cells demonstrate induced translation of VCIP during hypoxia. The transcriptional change (n-fold) was plotted as the number of VCIP transcripts isolated per microgram of total RNA from hypoxia-treated (4 h) versus normoxic (0 h) cytoplasmic lysates. The translational change (n-fold) was plotted as the number of VCIP transcripts isolated per microgram of polysomal RNA from hypoxia-treated (4 h) versus normoxic (0 h) lysates.
FIG. 5.
FIG. 5.
MMP13 mRNA is more efficiently translated during hypoxia in Perk+/+ cells. (A) Total mRNA expression is unaffected by hypoxia. Total RNA was isolated prior to sucrose gradient fractionation from hypoxia-treated (4 h) or normoxic (0 h) SV40-immortalized Perk+/+ and Perk−/− cells, reverse transcribed, and quantified by real-time PCR. The quantities of each transcript are described as the number of transcripts isolated per microgram of total RNA. Each sample was independently normalized to a spiked internal control. Q-PCR analysis was replicated in triplicate. Results are representative of the averages ± SEM for three independent experiments. (B) MMP13 transcripts are enriched in the polysomes of Perk+/+ cells during hypoxia. High-molecular-weight polysomes from hypoxia-treated (4 h) or normoxic (0 h) SV40-immortalized Perk+/+ and Perk−/− cells were pooled (fractions 6 to 10), reverse transcribed, and quantified by real-time PCR. The quantities of each transcript are described as the number of transcripts isolated per microgram of polysomal RNA. Each sample was independently normalized to a spiked internal control. Q-PCR analysis was repeated in triplicate. Results are representative of the averages ± SEM for three independent experiments. (C) Perk+/+ cells demonstrate induced translation of MMP13 during hypoxia. The transcriptional change (n-fold) was plotted as the number of MMP13 transcripts isolated per microgram of total RNA from hypoxia-treated (4 h) versus normoxic (0 h) cytoplasmic lysates. The translational change (n-fold) was plotted as the number of MMP13 transcripts isolated per microgram of polysomal RNA from hypoxia-treated (4 h) versus normoxic (0 h) lysates.
FIG. 6.
FIG. 6.
Transcription and translation of ATF3 mRNA is not dependent on Perk activity during hypoxia. (A) ATF3 total mRNA expression is induced by hypoxic stress. Total RNA was isolated prior to sucrose gradient fractionation from hypoxia-treated (4 h) or normoxic (0 h) SV40-immortalized Perk+/+ and Perk−/− cells, reverse transcribed, and quantified by real-time PCR. The quantities of each transcript are described as the number of transcripts isolated per microgram of total RNA. Each sample was independently normalized to a spiked internal control. Q-PCR analysis was replicated in triplicate. Results are representative of the averages ± SEM for three independent experiments. (B) ATF3 transcripts are enriched in the polysomes of Perk+/+ and Perk−/− cells during hypoxia. High-molecular-weight polysomes from hypoxia-treated (4 h) or normoxic (0 h) SV40-immortalized Perk+/+ and Perk−/− cells were pooled (fractions 6 to 10), reverse transcribed, and quantified by real-time PCR. The quantities of each transcript are described as the number of transcripts isolated per microgram of polysomal RNA. Each sample was independently normalized to a spiked internal control. Q-PCR analysis was repeated in triplicate. Results are representative of the averages ± SEM for three independent experiments. (C) Perk+/+ and Perk−/− cells demonstrate induced transcription and translation of ATF3 during hypoxia. The transcriptional change (n-fold) was plotted as the number of ATF3 transcripts isolated per microgram of total RNA from hypoxia-treated (4 h) versus normoxic (0 h) cytoplasmic lysates. The translational change (n-fold) was plotted as the number of ATF3 transcripts isolated per microgram of polysomal RNA from hypoxia-treated (4 h) versus normoxic (0 h) lysates.
FIG. 7.
FIG. 7.
VCIP 5′UTR is highly conserved. (A) The VCIP 5′UTR displays high conservation among several mammalian species. The various species are identified on the left with their percent identity to the human VCIP 5′UTR indicated. A dashed line specifies the areas within the 5′ UTR that share high homology with the human sequence. (B) A schematic of the various VCIP 5′UTR deletion constructs cloned into the β-Gal/CAT bicistronic vector.
FIG. 8.
FIG. 8.
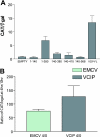
VCIP 5′UTR contains a functional IRES. (A) U2OS cells were transfected with β-Gal/EMPTY/CAT control vector, the full-length VCIP 5′UTR, or various constructs containing portions of the VCIP 5′UTR cloned into the bicistronic β-Gal/CAT expression construct. The IRES activity is expressed as the CAT activity divided by the β-Gal activity measured using cell lysates taken 24 h posttransfection. The error bars represent the averages ± SEM from four to eight independent experiments. (B) U2OS cells were transfected with either the β-Gal/EMCV/CAT or β-Gal/VCIP/CAT bicistronic plasmid. Cells were either treated by hypoxia for 4 h at 24 h posttransfection or left untreated, and the relative IRES activity was determined for each IRES. The bars represent the averages ± SEM from three to five independent experiments.
FIG. 9.
FIG. 9.
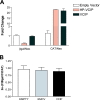
VCIP 5′UTR does not contain cryptic promoter activity or evidence of spurious splicing. (A) U2OS cells were transfected with the β-Gal/EMPTY/CAT, β-Gal/VCIP/CAT, or HP-β-Gal/VCIP/CAT bicistronic plasmid. β-Gal and CAT activity was measured from cell lysates taken 24 h posttransfection and normalized to the number of transfected cells based on neomycin activity. Reported β-Gal and CAT activities are expressed relative to measurements obtained for β-Gal/EMPTY/CAT. Bars represent the averages ± SEM from three independent experiments. (B) Quantitative RT-PCR was performed with total RNA isolated from U2OS cells transfected with the β-Gal/EMCV/CAT, β-Gal/EMPTY/CAT, or β-Gal/VCIP/CAT bicistronic plasmid. Q-PCRs were carried out to quantify the number of β-Gal and CAT cistrons expressed in each plasmid. The CAT/β-Gal ratio was calculated as 2−[Ct(CAT) − Ct(β-Gal)], where Ct is the crossing point. The bars represent the means ± SEM from six to seven independent experiments performed in triplicate.

References

    1. Ala-aho, R., and V. M. Kahari. 2005. Collagenases in cancer. Biochimie 87:273-286. - PubMed
    1. Ameri, K., E. M. Hammond, C. Culmsee, M. Raida, D. M. Katschinski, R. H. Wenger, E. Wagner, R. J. Davis, T. Hai, N. Denko, and A. L. Harris. 17 July 2006. Induction of activating transcription factor 3 by anoxia is independent of p53 and the hypoxic HIF signalling pathway. Oncogene [Epub ahead of print.] doi:10.1038/sj.onc.1209781. - DOI - PubMed
    1. Ameri, K., C. E. Lewis, M. Raida, H. Sowter, T. Hai, and A. L. Harris. 2004. Anoxic induction of ATF-4 through HIF-1-independent pathways of protein stabilization in human cancer cells. Blood 103:1876-1882. - PubMed
    1. Arsham, A. M., J. J. Howell, and M. C. Simon. 2003. A novel hypoxia-inducible factor-independent hypoxic response regulating mammalian target of rapamycin and its targets. J. Biol. Chem. 278:29655-29660. - PubMed
    1. Bernstein, J., O. Sella, S. Y. Le, and O. Elroy-Stein. 1997. PDGF2/c-sis mRNA leader contains a differentiation-linked internal ribosomal entry site (D-IRES). J. Biol. Chem. 272:9356-9362. - PubMed

Publication types

MeSH terms

LinkOut - more resources