. 2006 Oct 17;103(42):15675-80.
doi: 10.1073/pnas.0607501103. Epub 2006 Oct 9.

Myostatin modulates adipogenesis to generate adipocytes with favorable metabolic effects

Affiliations

Myostatin modulates adipogenesis to generate adipocytes with favorable metabolic effects

Brian J Feldman et al. Proc Natl Acad Sci U S A. .

Abstract

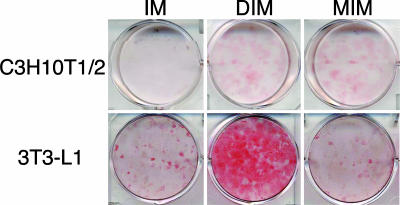
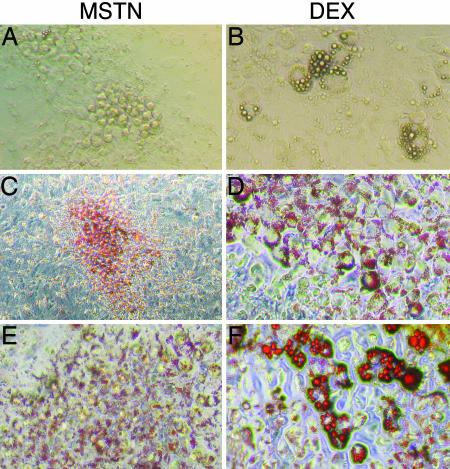
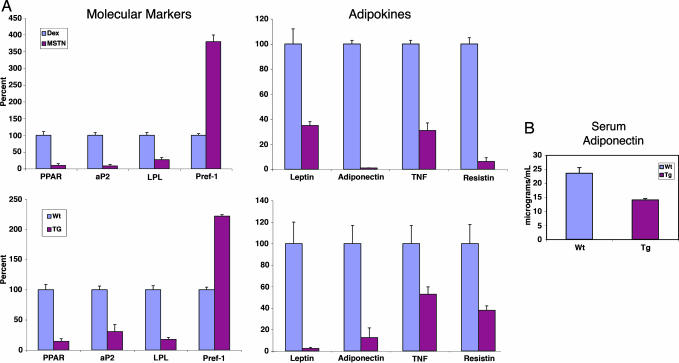
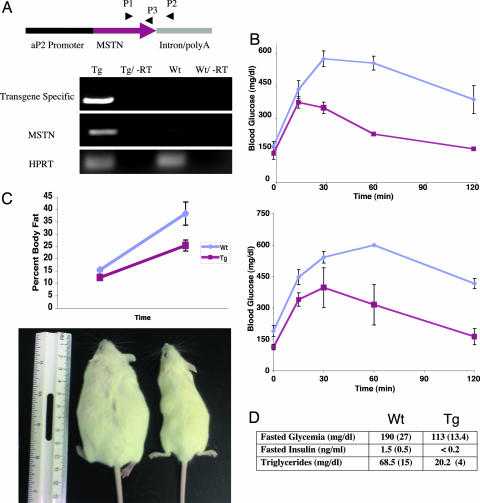
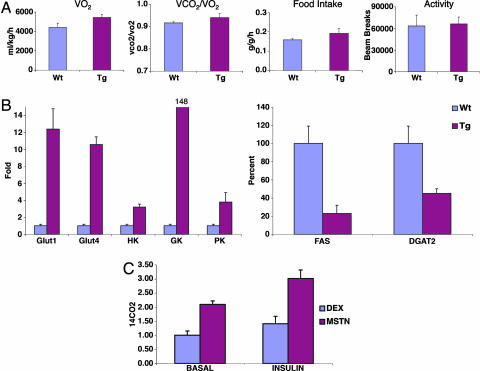
A pluripotent cell line, C3H10T1/2, is induced to undergo adipogenesis by a mixture of factors that includes a glucocorticoid such as dexamethasone. We found that expression of myostatin (MSTN), a TGF-beta family member extensively studied in muscle, was induced by dexamethasone under those differentiation conditions. Moreover, MSTN could substitute for dexamethasone in the adipogenesis mixture. However, the adipocytes induced by MSTN in both cell culture and transgenic mice were small and expressed markers characteristic of immature adipocytes. These adipocytes exhibited cell-autonomous increases in insulin sensitivity and glucose oxidation. In mice, these effects produced elevated systemic insulin sensitivity and resistance to diet-induced obesity. Modulation of the final stages of adipogenesis may provide a novel approach to understanding and treating metabolic disease.


Conflict of interest statement

The authors declare no conflict of interest.

Figures

Fig. 1.
Fig. 1.
MIM induced adipogenesis in C3H10T1/2 cells but not in 3T3-L1 cells. Either C3H10T1/2 (Upper) or 3T3-L1 (Lower) cells were grown to confluence. Cells were then exposed to isobutylmethylxanthine and insulin alone (IM, Left) or with DIM (Center) or MIM (Right). After 6–10 days of culture, cells were fixed and stained with Oil-Red-O to identify adipocytes. IM was not sufficient to induce adipogenesis in either cell line. DIM induced adipogenesis in both cell lines. In C3H10T1/2 cells, but not in 3T3-L1 cells, MIM induced adipogenesis.
Fig. 2.
Fig. 2.
MSTN induced adipogenesis in C3H10T1/2 cells. Adipogenesis was induced in confluent C3H10T1/2 cells with either MIM (A, C, and E) or DIM (B, D, and F). Cells were photographed under light microscopy while in culture (A and B) or after fixation and staining with Oil-Red-O (CF). Adipocytes formed after MSTN treatment were smaller and appeared to contain less lipid than the adipocytes formed after dexamethasone treatment. Cells exposed to either isobutylmethylxanthine and insulin or each component alone had minimal adipogenesis (data not shown). (Magnification: A, B, E, and F, ×200; C and D, ×100.)
Fig. 3.
Fig. 3.
Adipocytes generated with MSTN exposure have the expression profile of an immature adipocyte. (A) Real-time quantitative PCR was used to compare the expression patterns between adipocytes formed in culture after MIM or DIM exposure (n = 4 for each condition). (Upper Left) MSTN-induced adipocytes had lower levels of mature adipocyte markers peroxisome proliferator-activator receptor γ (PPAR), aP2, and lipoprotein lipase (LPL) and a higher level of the immature marker preadipocyte factor 1 (Pref-1). (Upper Right) Cultured MSTN-induced adipocytes also had lower expression levels of adipokines compared with dexamethasone-induced adipocytes. (Lower) MSTN transgenic (TG) mice had an analogues immature adipose tissue expression profile and lower levels of adipokine expression. (B) Transgenic animals had lower levels of circulating adiponectin as measured by ELISA performed on serum from transgenic (Tg) mice and WT littermates. Error bars represent SDs.
Fig. 4.
Fig. 4.
aP2-MSTN mice have a favorable metabolic profile and are resistant to obesity. (A) The transgene (Tg) construct was created by subcloning the full-length MSTN cDNA behind an aP2 promoter. Transgenic mice had a 10-fold overexpression of MSTN as detected by quantitative real-time PCR amplification of cDNA generated from the adipose tissue of WT and transgenic mice. Primers P1 and P2 were used to amplify a transgene-specific cDNA, whereas primers P1 and P3 were used to compare total MSTN expression levels. Quantitative PCR amplification of hypoxanthine-guanine phosphoribosyl transferase (HPRT) was used to control for cDNA concentration between samples. (B) Glucose tolerance tests were performed on both lean mice (Upper) and mice on a high-fat diet (Lower). Blood sugar levels were checked after an overnight fast (time = 0) and then 2 g/kg of glucose was injected i.p. After the glucose bolus, tail blood sugar levels were checked at each time point. At the 60-min time point, all WT animals on the high-fat diet had blood sugars above the upper limit of the meter, therefore the upper limit value (600 mg/dl) was used at that time point. aP2-MSTN mice were more insulin sensitive than their WT littermates on both regular (P = 0.0061) and high-fat chow (P = 0.0025). (C) aP2-MSTN mice and their WT littermates were placed on a high-fat diet for 7 weeks. Transgenic mice (Lower Right) were resistant to the obesity that developed in WT animals (Lower Left). (D) aP2-MSTN mice had lower fasting glucose, insulin, and triglyceride levels than their WT littermates. Error bars represent SDs.
Fig. 5.
Fig. 5.
aP2-MSTN transgenic mice have an increased metabolic rate with increased glycolysis in their adipose tissue compared with WT littermates. (A) Transgenic (Tg) and WT littermates were placed in metabolic cages that simultaneously measures metabolic rate (as calculated by gas exchange), activity, food intake, and weight. Transgenic animals had an increased metabolic rate (P = 0.005), slightly increased food intake, and similar activity as WT littermates. This increased metabolic rate likely contributes to protecting the animals from obesity. (B) Quantitative real-time PCR was used to measure the expression levels of genes involved in glucose utilization in the adipose tissue of the mice. Transgenic animals had higher expression levels than WT littermates of genes involved in glucose transport (GLUT1 and GLUT4) and enzymes in the glycolysis pathway [glucokinase (GK), hexokinase (HK), and pyruvate kinase (PK)]. In addition, the aP2-MSTN animals had lower expression levels of some of the genes involved in lipogenesis [fatty acid synthase (FAS) and diacylglycerol acyltransferase 2 (DGAT2)]. (C) The rate of glucose oxidation in adipocytes differentiated in tissue culture was directly measured by using 14C glucose (see Methods). Adipocytes generated after exposure to MIM have a cell autonomous higher rate of glucose oxidation than adipocytes generated after DIM exposure (P = 0.001). Error bars represent SDs.

References

    1. Shepherd PR, Gnudi L, Tozzo E, Yang H, Leach F, Kahn BB. J Biol Chem. 1993;268:22243–22246. - PubMed
    1. Kershaw EE, Flier JS. J Clin Endocrinol Metab. 2004;89:2548–2556. - PubMed
    1. Yu ZK, Wright JT, Hausman GJ. Obes Res. 1997;5:9–15. - PubMed
    1. Tang QQ, Otto TC, Lane MD. Proc Natl Acad Sci USA. 2004;101:9607–9611. - PMC - PubMed
    1. MacDougald OA, Mandrup S. Trends Endocrinol Metab. 2002;13:5–11. - PubMed

Publication types

LinkOut - more resources