. 2006 Oct 9;175(1):41-53.
doi: 10.1083/jcb.200606020.

Mapping the assembly pathways that specify formation of the trilaminar kinetochore plates in human cells

Affiliations

Mapping the assembly pathways that specify formation of the trilaminar kinetochore plates in human cells

Song-Tao Liu et al. J Cell Biol. .

Abstract

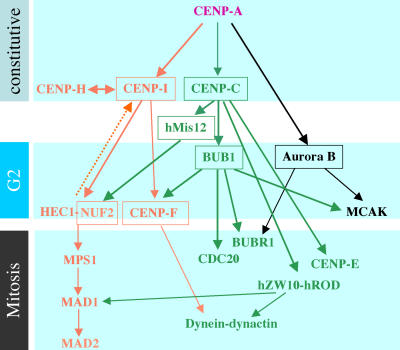
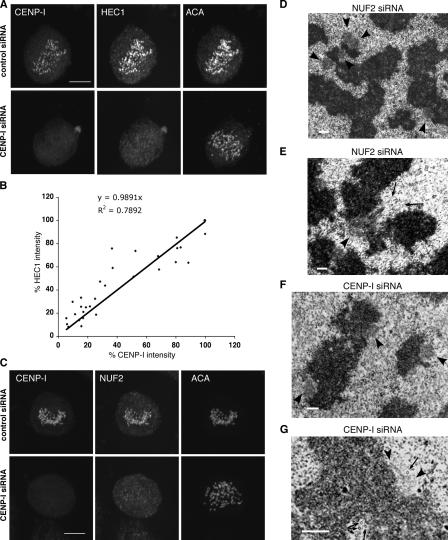
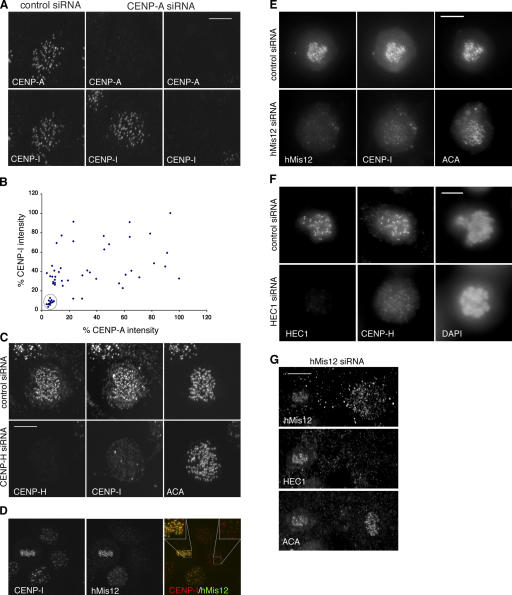
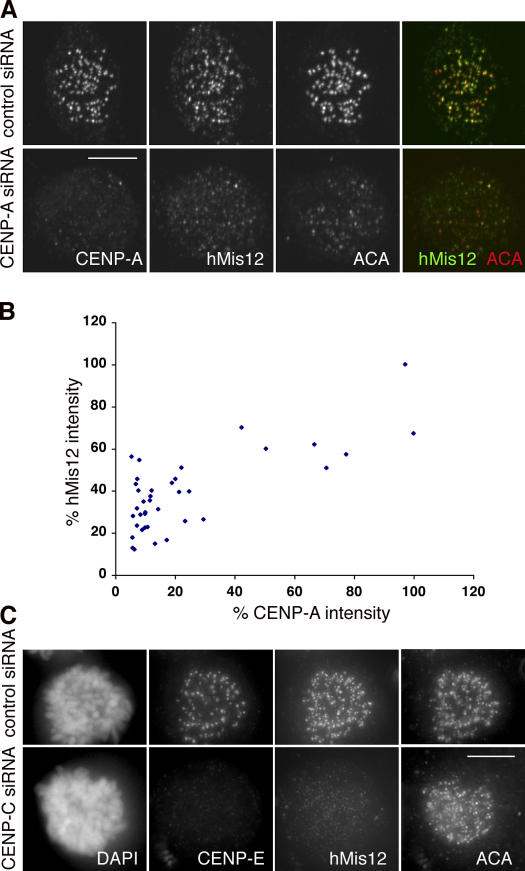
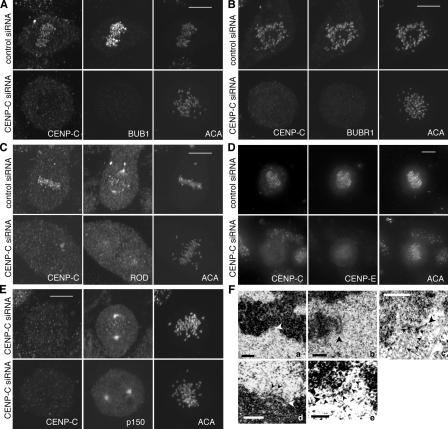
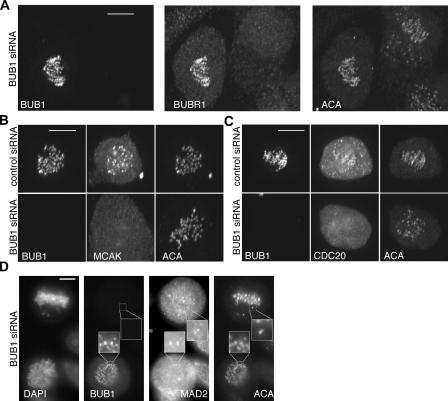
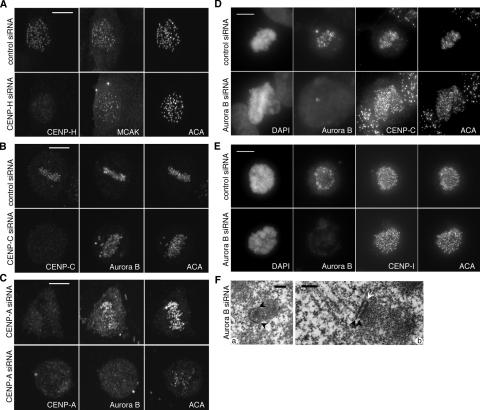
We report the interactions amongst 20 proteins that specify their assembly to the centromere-kinetochore complex in human cells. Centromere protein (CENP)-A is at the top of a hierarchy that directs three major pathways, which are specified by CENP-C, -I, and Aurora B. Each pathway consists of branches that intersect to form nodes that may coordinate the assembly process. Complementary EM studies found that the formation of kinetochore trilaminar plates depends on the CENP-I/NUF2 branch, whereas CENP-C and Aurora B affect the size, shape, and structural integrity of the plates. We found that hMis12 is not constitutively localized at kinetochores, and that it is not essential for recruiting CENP-I. Our studies also revealed that kinetochores in HeLa cells contain an excess of CENP-A, of which approximately 10% is sufficient to promote the assembly of normal levels of kinetochore proteins. We elaborate on a previous model that suggested kinetochores are assembled from repetitive modules (Zinkowski, R.P., J. Meyne, and B.R. Brinkley. 1991. J. Cell Biol. 113:1091-110).


Figures

Figure 1.
Figure 1.
A network of intersecting pathways that specify formation of a kinetochore module. Inner kinetochore proteins are positioned at the top. Proteins are also arranged (top to bottom) with respect to their relative temporal order of appearance at kinetochores (the temporal sequence for mitotic kinetochore proteins is not very clear, except that BUBR1 appears before CENP-E). Thick solid arrows show connections examined in this study; thinner arrows indicate previous published interactions that were not elaborated on in this study. The dashed arrow denotes a potential feedback mechanism between CENP-I and the HEC1–NUF2 complex. Boxes denote proteins whose roles in kinetochore assembly were examined by EM.
Figure 2.
Figure 2.
Localization of HEC1 complex depends on CENP-I. (A and C) Control or CENP-I–depleted HeLa cells (top and bottom rows, respectively) were costained with CENP-I, anticentromere antibody (ACA), and HEC1 (A) or NUF2 (C) antibodies. Images are presented as maximum projections of z series. (B) HEC1 fluorescence intensities on kinetochores with different levels of CENP-I (31 kinetochores in 10 cells) were quantitated, normalized to the brightest signal (100%), and plotted against corresponding CENP-I intensities. (D–G) Representative EM images of kinetochores in NUF2 (D–E) and CENP-I (F–G) siRNA-transfected cells. (D and F) Fuzzy ball–shaped kinetochores (arrowheads) lacking microtubules are commonly seen. (E) Microtubules (arrows) interact laterally with a fuzzy kinetochore (arrowhead). (G) A kinetochore with half plate (left arrowhead) and half fuzzy ball (right arrowhead) structure. Some microtubules (arrows) pass perpendicularly to the section plane. Bars: (A and C) 10 μm; (D–G) 400 nm.
Figure 3.
Figure 3.
Localization of CENP-I depends on CENP-A and -H, but not hMis12. (A) Interphase cells with different levels of CENP-A were costained with CENP-I. Exposure times were identical for the same protein. (B) Comparison of the normalized fluorescence intensities of CENP-A and -I at 54 centromeres from 12 interphase cells transfected with CENP-A siRNA. The intensity of each protein at the brightest kinetochore is taken as 100%. (C) Maximum projections of a control (top) and a CENP-H–depleted mitotic cell (bottom) stained with antibodies against CENP-H, -I, and ACA. (D) Maximum projections of deconvolved images of normal HeLa cells in mitosis (center left) and early G1 (center right) that were stained with anti–CENP-I and anti-hMis12 antibodies. (E) Maximum projections of deconvolved images of a control (top) and a hMis12-depleted mitotic cell (bottom) stained with antibodies against hMis12, CENP-I, and ACA. (F) Comparison of HEC1 and CENP-H intensities in a control (top) and HEC1 siRNA–transfected (bottom) cells. Single optical plane is shown here. (G) A hMis12-reduced and a hMis12-depleted cell in the same field were stained with ACA and antibodies against hMis12 and HEC1. Bar, 10 μm.
Figure 4.
Figure 4.
hMis12 localization depends on CENP-A and CENP-C. (A) Maximum projections of a control (top) and a CENP-A–depleted mitotic cell (bottom) stained with CENP-A, hMis12, and ACA. Note the weaker hMis12 and ACA signals in the CENP-A–depleted cell. (B) Comparison of the normalized fluorescence intensities of CENP-A and hMis12 at 38 kinetochores from 13 mitotic cells transfected with CENP-A siRNA. The intensity of each protein at the brightest kinetochore is taken as 100%. (C) Maximum projections of a control (top) and a CENP-C–depleted mitotic cell (bottom) stained with CENP-E, hMis12, and ACA antibodies. CENP-E is used as a readout for depletion of CENP-C. Bars, 10 μm.
Figure 5.
Figure 5.
Kinetochore localization of BUB1, BUBR1, hROD, CENP-E, and p150glued depends on CENP-C. (A–E) Maximum projections of control cells (A–D) or cells with reduced CENP-C (E; top rows) and CENP-C–depleted mitotic cells (bottom rows) costained with CENP-C, ACA, and BUB1 (A), BUBR1 (B), hROD (C), CENP-E (D), p150glued (E). Bar, 10 μm. (F) Representative EM images of kinetochores in CENP-C siRNA–transfected cells. Big arrowheads indicate the positions of kinetochores. (a) A kinetochore with short plates and a few attached microtubules. (b–c) Kinetochores pulled out of the surface of the chromosome. A few attached microtubules are indicated by small arrows in c. They are absent in b. (d) A kinetochore with no microtubule binding showing some fibrils extending (small arrowheads) from the outer plate. (c and e) Some kinetochores show a distinct beaded structure in their outer plates (small arrowheads). Bars: (a–d) 400 nm; (e) 200 nm.
Figure 6.
Figure 6.
Kinetochore localization of BUBR1, MCAK, and CDC20, but not MAD2, depends on BUB1. Maximum projections of untransfected cells (A, left cell; D, bottom cell) or control cells (B–C, top rows) and BUB1-depleted mitotic cells (A, right cell; B–C bottom rows; D, top cell) costained with BUB1, ACA, and BUBR1 (A), MCAK (B), CDC20 (C), MAD2 (D). Bar, 10 μm.
Figure 7.
Figure 7.
Localization of Aurora B depends on CENP-A. (A) A control (top) and a CENP-H–depleted (bottom) late G2/early prophase cell costained for CENP-H, MCAK, and ACA. (B and C) Maximum projections of cells costained for Aurora B, ACA, and CENP-C (B) or -A (C). The bottom rows show the CENP-C– (B) or CENP-A–depleted (C) cells. The top row in B shows a control mitotic cell. The top row in C shows a cell with less reduced CENP-A and nearly normal levels of Aurora B and ACA. (D–E) Maximum projections of control and Aurora B–depleted cells (top and bottom rows, respectively) costained with Aurora B, ACA, and CENP-C (D) or -I (E). (F) Under EM, the kinetochores in Aurora B–depleted cells maintain the plate structures, but either expand and extend significantly to a “C” shape without microtubule binding (a) or display “hairpin” structure, with outer and inner plates seemingly fused at one end (b).

References

    1. Adams, R.R., M. Carmena, and W.C. Earnshaw. 2001. Chromosomal passengers and the (aurora) ABCs of mitosis. Trends Cell Biol. 11:49–54. - PubMed
    1. Amor, D.J., P. Kalitsis, H. Sumer, and K.H. Choo. 2004. Building the centromere: from foundation proteins to 3D organization. Trends Cell Biol. 14:359–368. - PubMed
    1. Andrews, P.D., Y. Ovechkina, N. Morrice, M. Wagenbach, K. Duncan, L. Wordeman, and J.R. Swedlow. 2004. Aurora B regulates MCAK at the mitotic centromere. Dev. Cell. 6:253–268. - PubMed
    1. Bharadwaj, R., W. Qi, and H. Yu. 2004. Identification of two novel components of the human NDC80 kinetochore complex. J. Biol. Chem. 279:13076–13085. - PubMed
    1. Blower, M.D., and G.H. Karpen. 2001. The role of Drosophila CID in kinetochore formation, cell-cycle progression and heterochromatin interactions. Nat. Cell Biol. 3:730–739. - PMC - PubMed

Publication types

MeSH terms