. 2006 Oct 17;103(42):15445-50.
doi: 10.1073/pnas.0607141103. Epub 2006 Oct 10.

Proton-proton Overhauser NMR spectroscopy with polypeptide chains in large structures

Affiliations

Proton-proton Overhauser NMR spectroscopy with polypeptide chains in large structures

Reto Horst et al. Proc Natl Acad Sci U S A. .

Abstract

The use of 1H-1H nuclear Overhauser effects (NOE) for structural studies of uniformly deuterated polypeptide chains in large structures is investigated by model calculations and NMR experiments. Detailed analysis of the evolution of the magnetization during 1H-1H NOE experiments under slow-motion conditions shows that the maximal 1H-1H NOE transfer is independent of the overall rotational correlation time, even in the presence of chemical exchange with the bulk water, provided that the mixing time is adjusted for the size of the structure studied. 1H-1H NOE buildup measurements were performed for the 472-kDa complex of the 72-kDa cochaperonin GroES with a 400-kDa single-ring variant of the chaperonin GroEL (SR1). These experiments demonstrate that multidimensional NOESY experiments with cross-correlated relaxation-enhanced polarization transfer and transverse relaxation-optimized spectroscopy elements can be applied to structures of molecular masses up to several hundred kilodaltabs, which opens new possibilities for studying functional interactions in large maromolecular assemblies in solution.


Conflict of interest statement

The authors declare no conflict of interest.

Figures

Fig. 1.
Fig. 1.
Plots of simulated NOE cross peak intensities, aijm), versus the mixing time τm (Eq. 6). The atom coordinates of all backbone amide protons and the exchangeable side chain protons of one subunit of GroES were used for the calculation, as described in Materials and Methods. Three different, effective rotational correlation times are considered, i.e., τc = 100 ns (dotted line), 185 ns (solid line), and 350 ns (dashed line), where τc = 185 and 350 ns are estimates for the GroES complexes with SR1 and GroEL, respectively. For the side chain hydroxyl protons of Ser, Thr, and Tyr, and the side chain 15N-bound protons of Arg and Lys, the exchange rate was set to 150 s−1 (49). (a) aijm) for the amide proton pair of V43 and G44, which has only weak exchange contributions, because the two atoms are separated by 4.3 Å, and both hydrogens are >8.0 Å from the nearest rapidly exchanging proton. (b) aijm) for the amide proton pair of S35 and T36, which has strong exchange effects, because the two atoms are separated from each other by 4.5 Å, and both amide protons are close to their side chain hydroxyl groups.
Fig. 2.
Fig. 2.
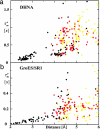
Optimal mixing time, τmo, for pairs of backbone amide protons plotted versus the 1H–1H distance. The distances between the amide protons were calculated from the crystal structures, as described in Materials and Methods. The data were calculated with Eqs. 11 and 12. (a) τmo for proton pairs in one subunit of DHNA, calculated with τc = 45 ns (50). (b) τmo for proton pairs in one subunit of GroES in the complex with SR1, calculated with τc = 185 ns (51). The data points are color-coded according to the optimal transfer efficiencies (Eq. 11): black, aijmax > 0.1; red, aijmax > 0.05; yellow, aijmax ≤ 0.05.
Fig. 3.
Fig. 3.
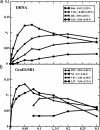
Experimental NOE build-up curves. NOE transfer efficiencies, aij, are plotted versus the mixing time, τm. The NOE intensities were obtained from a series of 2D 15N-selected [1H,1H]-NOESY experiments (Fig. 5, which is published as supporting information on the PNAS web site) recorded on a Bruker Avance 900 MHz NMR spectrometer. (a) DHNA. (b) GroES in a 1:1 complex with SR1. The individual cross peak assignments and the distances between the interacting spin pairs are indicated in the figure. In b, the signals for V43/G44 and L57/V59 obtained for short mixing times were too weak for reliable intensity measurements.
Fig. 4.
Fig. 4.
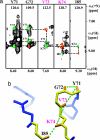
Spectral and structural analysis of NMR data recorded with the GroES/SR1 complex. (a) [ω1(1H), ω3(1H)] strips from a 3D [1H,1H]-NOESY-[15N,1H]-CRINEPT-HMQC spectrum of the GroES/SR1 complex. The spectrum was recorded at T = 25°C using a Bruker Avance 900 NMR spectrometer (see Supporting Text for the experimental scheme used). The mixing time τm was 100 ms, the data size was 64(t1) × 20(t2) × 1,024(t3) complex points, t1max = 5.1 ms, t2max = 6.2 ms, t3max = 81.1 ms, and 136 scans per increment were acquired in a total measuring time of 6 days. The spectrum was processed with the program PROSA (47). Strips from the backbone amide protons 71–74 and 85 are shown. Sequence-specific resonance assignments are indicated by the one-letter amino acid code above each strip, and magenta letters indicate residues where the amino acid type was determined by residue-specific 15N labeling. The direct correlation peaks and the assigned cross-peaks for each residue are marked in orange and green, respectively. The 15N chemical shifts are indicated at the top of the strips. (b) Close-up view of the structural fragment of GroES in the complex with SR1 (18) that gives rise to the data presented in a. The assigned residues are highlighted in yellow and orange, and the distances dNN observed in the NOESY spectrum are shown by the green dotted lines.

References

    1. Tugarinov V, Muhandiram R, Ayed A, Kay LE. J Am Chem Soc. 2002;124:10025–10035. - PubMed
    1. Fernandez C, Adeishvili K, Wüthrich K. Proc Natl Acad Sci USA. 2001;98:2358–2363. - PMC - PubMed
    1. Kay LE. J Magn Reson. 2005;173:193–207. - PubMed
    1. Salzmann M, Pervushin K, Wider G, Senn H, Wüthrich K. J Am Chem Soc. 2000;122:7543–7548.
    1. Salzmann M, Pervushin K, Wider G, Senn H, Wüthrich K. Proc Natl Acad Sci USA. 1998;95:13585–13590. - PMC - PubMed

Publication types