. 2006 Oct 17;103(42):15635-40.
doi: 10.1073/pnas.0603344103. Epub 2006 Oct 10.

Interplay between PIP3 and calmodulin regulation of olfactory cyclic nucleotide-gated channels

Affiliations

Interplay between PIP3 and calmodulin regulation of olfactory cyclic nucleotide-gated channels

James D Brady et al. Proc Natl Acad Sci U S A. .

Abstract

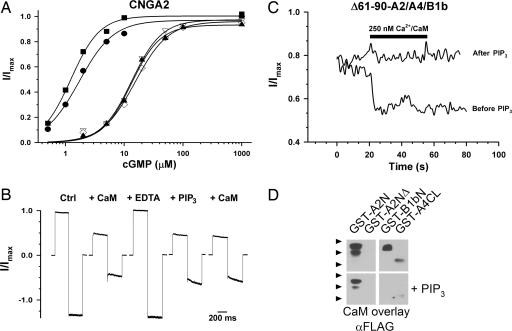
Phosphatidylinositol-3,4,5-trisphosphate (PIP3) has been proposed to modulate the odorant sensitivity of olfactory sensory neurons by inhibiting activation of cyclic nucleotide-gated (CNG) channels in the cilia. When applied to the intracellular face of excised patches, PIP3 has been shown to inhibit activation of heteromeric olfactory CNG channels, composed of CNGA2, CNGA4, and CNGB1b subunits, and homomeric CNGA2 channels. In contrast, we discovered that channels formed by CNGA3 subunits from cone photoreceptors were unaffected by PIP3. Using chimeric channels and a deletion mutant, we determined that residues 61-90 within the N terminus of CNGA2 are necessary for PIP3 regulation, and a biochemical "pulldown" assay suggests that PIP3 directly binds this region. The N terminus of CNGA2 contains a previously identified calcium-calmodulin (Ca2+/CaM)-binding domain (residues 68-81) that mediates Ca2+/CaM inhibition of homomeric CNGA2 channels but is functionally silent in heteromeric channels. We discovered, however, that this region is required for PIP3 regulation of both homomeric and heteromeric channels. Furthermore, PIP3 occluded the action of Ca2+/CaM on both homomeric and heteromeric channels, in part by blocking Ca2+/CaM binding. Our results establish the importance of the CNGA2 N terminus for PIP3 inhibition of olfactory CNG channels and suggest that PIP3 inhibits channel activation by disrupting an autoexcitatory interaction between the N and C termini of adjacent subunits. By dramatically suppressing channel currents, PIP3 may generate a shift in odorant sensitivity that does not require prior channel activity.


Conflict of interest statement

The authors declare no conflict of interest.

Figures

Fig. 1.
Fig. 1.
PIP3 inhibits CNGA2 channels but not CNGA3 channels. Representative traces from CNGA2 (A) and CNGA3 (B) before and after application of 10 μM PIP3. Currents were elicited by voltage steps to +50 and –50 mV in the presence of the indicated concentration of cyclic nucleotides. Data are representative of 12 patches for CNGA2 and 6 patches for CNGA3. (C) Two different patches containing CNGA2 channels activated by 1 mM cAMP and held at −50 mV were exposed to 10 μM or 1 μM PIP3 at 15 s (denoted by arrow). Data were normalized to the current level before PIP3 exposure. Representative CNGA2 (D) and CNGA3 (E) cyclic nucleotide dose–response relationships before (filled symbols) and after (open symbols) application of 10 μM PIP3. Hill parameters (K1/2, n) for CNGA2: (▾) cGMP = 1.6 μM, 2.2 before PIP3, and (▿) 21.5 μM, 2.1 after PIP3; (●) cAMP = 51.2 μM, 1.9 before PIP3, and (○) 1.4 mM, 1.5 after PIP3; for CNGA3: (▾) cGMP = 21.6 μM, 2.2 before PIP3, and (▿) 25.8 μM, 2.1 after PIP3; (●) cAMP = 1.8 mM, 1.3 before PIP3, and (○) 1.5 mM, 1.7 after PIP3. Open circles in E overlap and hide the filled circles. Data are representative of three separate experiments each for CNGA2 and CNGA3.
Fig. 2.
Fig. 2.
The N terminus of CNGA2 confers PIP3 sensitivity to CNGA3 channels. (A) Diagrams depicting CNGA2/CNGA3 chimeric subunits are shown on the left (see Methods for splice site locations). Portions of the channel sequence derived from CNGA2 are shown in black; portions derived from CNGA3 are shown in gray. Plotted adjacent is the mean K1/2 for cGMP before (●) and after (○) 10 μM PIP3. K1/2 values ± SD are as follows: A3, 18.6 ± 7 μM before PIP3 and 20.5 ± 8 μM after PIP3, three patches; 3322, 24.0 ± 9 μM before PIP3 and 24.6 ± 11 μM after PIP3, three patches; A2nA3, 9.3 ± 2.3 μM before and 43.5 ± 13.8 μM after, five patches; 2333, 10.6 ± 4 μM before and 64 ± 19 μM after, four patches; 2233, 12.0 ± 2.4 μM before and 57.3 ± 7 μM after, three patches; CNGA2, 1.8 ± 1 μM before and 23.9 ± 11 μM after, nine patches. (B) Representative cyclic nucleotide dose–response relationships, before (filled symbols) and after (open symbols) application of 10 μM PIP3, for channels containing A2nA3 subunits. Hill equation parameters (K1/2, n): (▾), cGMP = 6.8 μM, 2.1 before PIP3 and (▿) 31.8 μM, 2.4 after PIP3; (●), cAMP = 1.0 mM, 2.1 before PIP3 and (○) K1/2 = 2.1 mM, 2.9 after PIP3. Data are representative of four different patches.
Fig. 3.
Fig. 3.
PIP3 inhibits olfactory CNG channels through a direct interaction with the N terminus of CNGA2. (A) Shown are representative cyclic nucleotide dose–response relationships for Δ61–90-CNGA2, measured before (filled symbols) and after (open symbols) treatment with 10 μM PIP3. Hill equation parameters (K1/2, n): (▾) cGMP 22.6 μM, 2.8 before PIP3 and (▿) 26.9 μM, 2.2 after PIP3; (●) cAMP = 1.2 mM, 1.4 before PIP3 and (○) 917 μM, 1.6 after PIP3. Data are representative of three different experiments. (B) N-terminal regions of CNGA2 and CNGA3 were expressed as GST-fusion proteins and tested for PIP3 binding in vitro by using PIP3-agarose beads. Input proteins (Left and Right Lower) and bound proteins (Middle and Right Upper) were identified by immunoblotting with anti-GST antibodies. GST-Grp1PH, positive control pleckstrin homology domain (Echelon); GST-A2N, N-terminal cytoplasmic domain (amino acids 1–138) of rat CNGA2 (AF126808); GST-A2NΔ, amino acids 61–90 deleted; GST-A3N, N-terminal cytoplasmic domain (amino acids 1–164) of human CNGA3 (AF065314); GST-A3NΔ, amino acids 51–108 deleted. Data are representative of four different experiments. (C) Representative cGMP dose–response relationships before (filled symbols) and after (open symbols) application of 10 μM PIP3 to a patch containing wtCNGA2/A4/B1b channels. Hill equation parameters (K1/2, n): (▾) cGMP, 2.3 μM, 2.6 before PIP3 and (▿) 14.6 μM, 1.8 after PIP3; (●) cAMP, 6.4 μM, 2.8 before PIP3 and (○) 48.4 μM, 2.0 after PIP3. (D) Representative cGMP dose–response relationships before and after application of 10 μM PIP3 to a patch containing ▵61–90-CNGA2/A4/B1b channels. Hill equation parameters (K1/2, n): (▾) cGMP, 16.3 μM, 2.6 before PIP3 and (▿) 16.5 μM, 2.7 after PIP3; (●) cAMP, 70.4 μM, 1.4 before PIP3 and (○) 51.4 μM, 1.2 after PIP3. Data are representative of five patches for WT channels and three patches for deletion mutants.
Fig. 4.
Fig. 4.
PIP3 prevents calmodulin regulation of olfactory CNG channels. (A) CNGA2 cGMP dose–response relationships were measured before (●) and after (▿) application of 250 nM Ca2+/CaM. The patch then was washed with 0.5 mM EDTA (■) to remove the CaM. A 10 μM concentration of PIP3 (◇) caused a right shift that occluded a response to subsequent application of CaM (▴). K1/2 values: before CaM, 1.7 μM; after CaM, 13.3 μM; EDTA wash, 1.2 μM; after PIP3, 15.3 μM; PIP3 + CaM, 13.2 μM. Data are representative of four separate experiments. (B) Representative traces from an inside-out patch containing wtCNGA2/A4/B1b channels stepped to +50 mV and –50 mV and exposed to solutions containing either 500 nM Ca2+/CaM or 10 μM PIP3. Data are representative of three separate experiments. (C) Representative trace from an inside-out patch containing Δ61–90-CNGA2/A4/B1b channels before and after exposure to 10 μM PIP3. The current activated by 50 μM cGMP was measured at +50 mV every second and normalized to the current activated by 1 mM cGMP. Ca2+/CaM (250 nM) was added at 20 s. Data are representative of three separate experiments. (D) After blotting, GST-fusion proteins were probed in an overlay assay by using ≈50 nM FLAG-tagged CaM in 10 μM buffered calcium, either in the presence (below) or in the absence (above) of 100 μM PIP3. GST-A2N and GST-A2NΔ are as in Fig. 3B; GST-B1bN, proximal N-terminal region (amino acids 677–764) of bovine CNGB1; GST-A4CL, C-linker region (amino acids 271–339) of rat CNGA4. Bound CaM-FLAG was detected by using M2 anti-FLAG antibody. Arrowheads indicate approximate location of molecular mass markers: 49, 38, and 28 kDa. Corresponding blots above and below each other represent identical exposure times. Data are representative of six different experiments.

References

    1. Buck L, Axel R. Cell. 1991;65:175–187. - PubMed
    1. Ronnett GV, Moon C. Annu Rev Physiol. 2002;64:189–222. - PubMed
    1. Ache BW, Young JM. Neuron. 2005;48:417–430. - PubMed
    1. Axel R. Angew Chem Int Ed Engl. 2005;44:6110–6127. - PubMed
    1. Kaupp UB, Seifert R. Physiol Rev. 2002;82:769–824. - PubMed

Publication types

MeSH terms