

Relative moldiness index as predictor of childhood respiratory illness
- PMID: 17033680
- PMCID: PMC2233948
- DOI: 10.1038/sj.jes.7500528
Relative moldiness index as predictor of childhood respiratory illness
Abstract
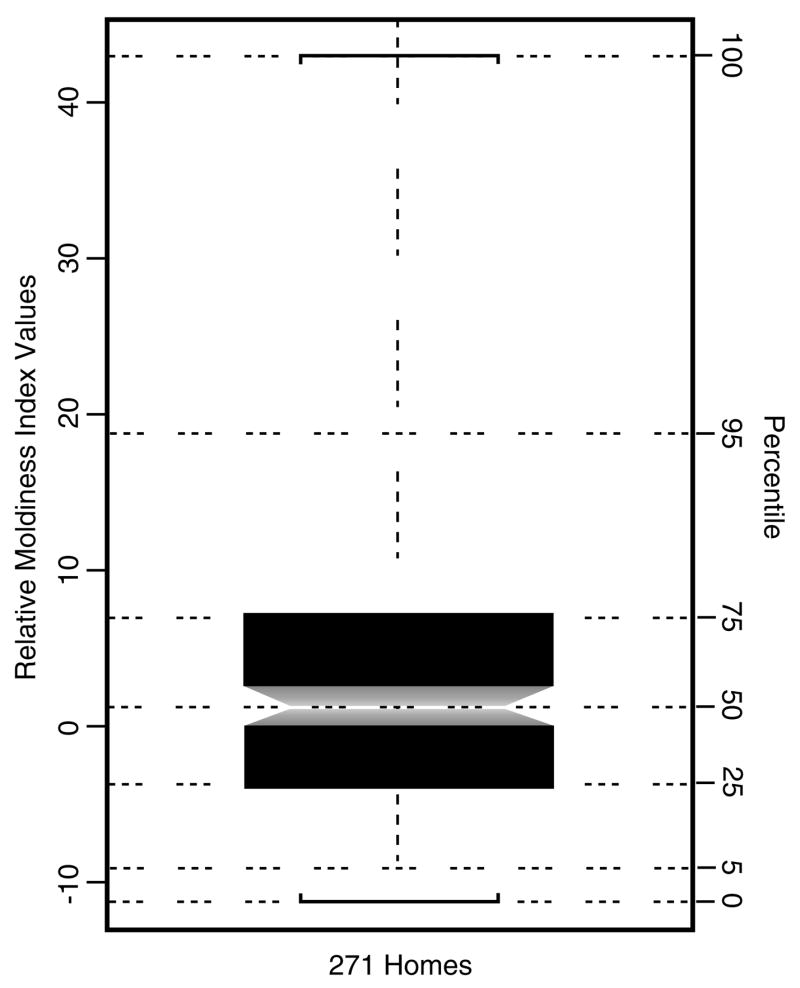
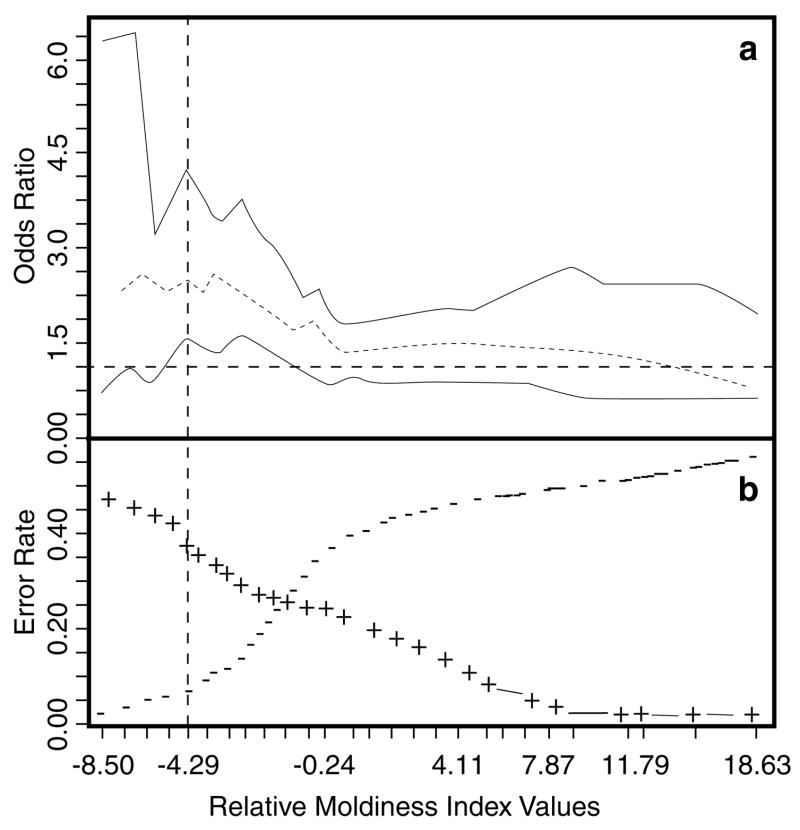
The results of a traditional visual mold inspection were compared to a mold evaluation based on the Relative Moldiness Index (RMI). The RMI is calculated from mold-specific quantitative PCR (MSQPCR) measurements of the concentration of 36 species of molds in floor dust samples. These two prospective mold evaluations were used to classify the mold condition in 271 homes of infants. Later, the development of respiratory illness was measured in the infants living in these homes and the predictive value of each classification system was evaluated. The binary classification of homes as either moldy or non-moldy by on-site visual home inspection was not predictive of the development of respiratory illness (wheeze and/or rhinitis) (P=0.27). Conversely, a method developed and validated in this paper, using the RMI index fit to a logistic function, can be used to predict the occurrence of illness in homes and allows stake-holders the choice among various levels of risk.
Figures
References
-
- Belanger K, Beckett W, Triche E, Bracken MB, Holford T, Ren P, McSharry JE, Gold DR, Platts-Mills TA, Leaderer BP. Symptoms of wheeze and persistent cough in the first year of life: associations with indoor allergens, air contaminants, and maternal history of asthma. Am J Epidemiol. 2003;158:195–202. - PubMed
-
- Benjamini Y, Hochberg Y. Controlling the false-discovery rate: a practical and powerful approach to multiple testing. J Royal Stat Soc Series B. 1995;57:289–300.
Publication types
MeSH terms
Grants and funding
LinkOut - more resources
Full Text Sources
Medical
