. 2006 Nov;79(5):831-45.
doi: 10.1086/508571. Epub 2006 Sep 21.

Test for interaction between two unlinked loci

Affiliations

Test for interaction between two unlinked loci

Jinying Zhao et al. Am J Hum Genet. 2006 Nov.

Abstract

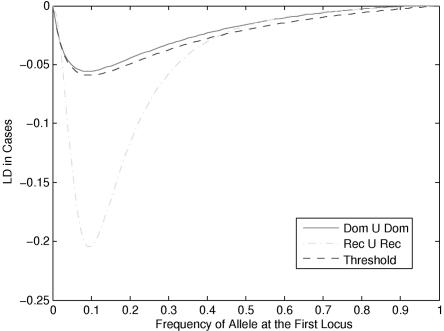
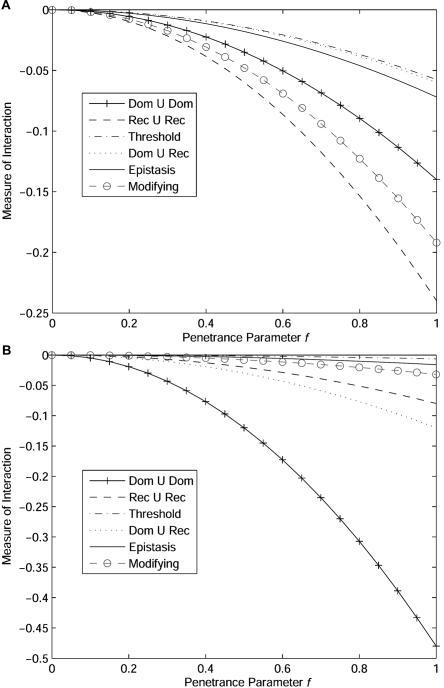
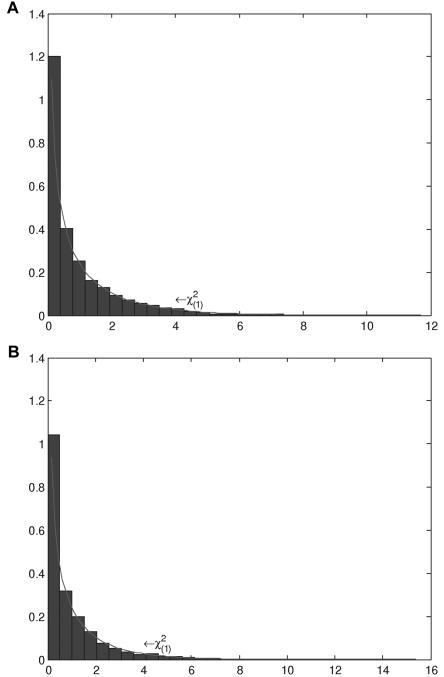
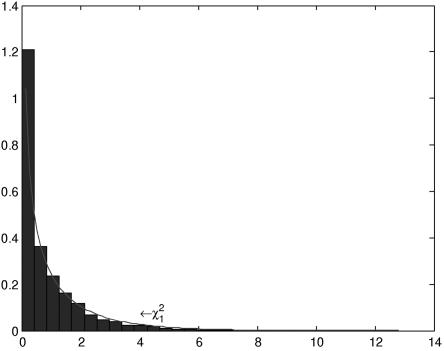
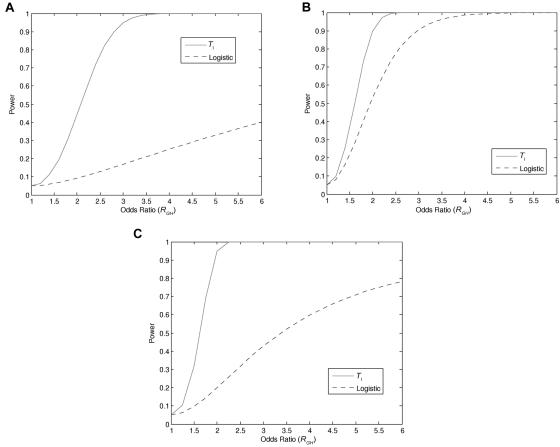
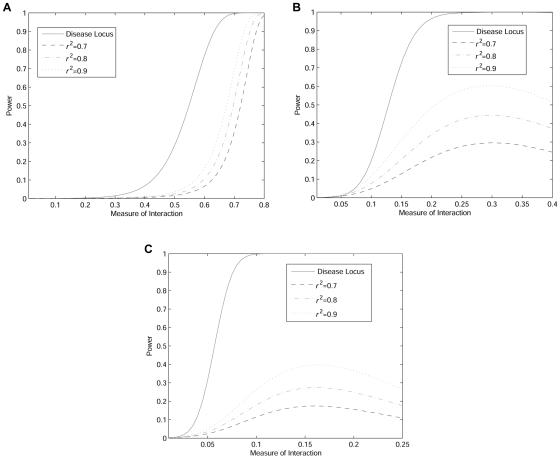
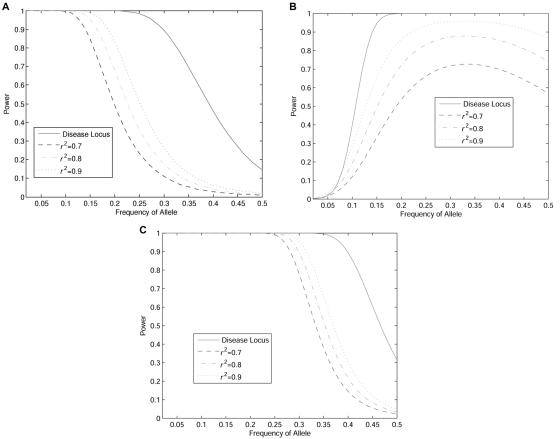
Despite the growing consensus on the importance of testing gene-gene interactions in genetic studies of complex diseases, the effect of gene-gene interactions has often been defined as a deviance from genetic additive effects, which is essentially treated as a residual term in genetic analysis and leads to low power in detecting the presence of interacting effects. To what extent the definition of gene-gene interaction at population level reflects the genes' biochemical or physiological interaction remains a mystery. In this article, we introduce a novel definition and a new measure of gene-gene interaction between two unlinked loci (or genes). We developed a general theory for studying linkage disequilibrium (LD) patterns in disease population under two-locus disease models. The properties of using the LD measure in a disease population as a function of the measure of gene-gene interaction between two unlinked loci were also investigated. We examined how interaction between two loci creates LD in a disease population and showed that the mathematical formulation of the new definition for gene-gene interaction between two loci was similar to that of the LD between two loci. This finding motived us to develop an LD-based statistic to detect gene-gene interaction between two unlinked loci. The null distribution and type I error rates of the LD-based statistic for testing gene-gene interaction were validated using extensive simulation studies. We found that the new test statistic was more powerful than the traditional logistic regression under three two-locus disease models and demonstrated that the power of the test statistic depends on the measure of gene-gene interaction. We also investigated the impact of using tagging SNPs for testing interaction on the power to detect interaction between two unlinked loci. Finally, to evaluate the performance of our new method, we applied the LD-based statistic to two published data sets. Our results showed that the P values of the LD-based statistic were smaller than those obtained by other approaches, including logistic regression models.


Figures

Figure  1.
Figure 1.
LD between two unlinked loci in a disease population under three two-locus disease models as a function of allele frequency at the first locus, under the assumption that the allele frequency at the second locus equals 0.1.
Figure  2.
Figure 2.
Measure of interaction between two unlinked loci as a function of the penetrance parameter under six two-locus disease models, under the assumption that allele frequencies at the first and second loci equal either 0.3 and 0.8, respectively (A), or 0.2 and 0.4, respectively (B).
Figure  3.
Figure 3.
Null distribution of the test statistic TI by use of 150 individuals (A) or 250 individuals (B) from both the cases and the controls in a homogeneous population.
Figure  4.
Figure 4.
Null distribution of the test statistic TI by use of 300 individuals from both the cases and the controls in an admixed population.
Figure  5.
Figure 5.
Power of the test statistic TI and logistic regression analysis as a function of interaction odds ratio (RGH) under three different models. A, Recessive × recessive model, under the assumption that the risk allele frequencies at both loci G and H are 0.2, number of individuals in both cases and controls are 500, population risk is 0.001, significance level is 0.05, and odds ratios RG=5 and RH=5. B, Dominant × dominant model, under the assumption that the risk allele frequencies at both loci G and H are 0.1, number of individuals in both cases and controls are 500, population risk is 0.001, significance level is 0.05, and odds ratios RG=2 and RH=2. C, Additive × additive model, under the assumption that the risk allele frequencies at both loci G and H are 0.1, number of individuals in both cases and controls are 100, population risk is 0.001, significance level is 0.05, and odds ratios RG=2 and RH=2.
Figure  6.
Figure 6.
Power of the test statistic TI as a function of the interaction measure between two unlinked loci under a two-locus disease model. A, Dom ∪ Dom, under the assumption that the number of individuals in both cases and controls are 500, penetrance parameter f=1, allele frequency at the second locus is 0.1, and significance level is 0.05. B, Dom ∪ Rec, under the assumption that the number of individuals in both cases and controls are 250, penetrance parameter f=1, allele frequency at the second locus is 0.1, and significance level is 0.05. C, Rec ∪ Rec, under the assumption that the number of individuals in both cases and controls are 500, penetrance parameter f=1, allele frequency at the second locus is 0.5, and significance level is 0.05.
Figure  7.
Figure 7.
Power of the test statistic TI as a function of allele frequency at the first locus under a two-locus disease model. A, Dom ∪ Dom, under the assumptions that the number of individuals in both cases and controls are 500, penetrance parameter f=1, allele frequency at the second locus is 0.1, and significance level is 0.05. B, Dom ∪ Rec, under the assumptions that the number of individuals in both cases and controls are 500, penetrance parameter f=1, allele frequency at the second locus is 0.1, and significance level is 0.05. C, Rec ∪ Rec, under the assumptions that the number of individuals in both cases and controls are 500, penetrance parameter f=1, allele frequency at the second locus is 0.1, and significance level is 0.05.

References

    1. Cook NR, Zee RY, Ridker PM (2004) Tree and spline based association analysis of gene-gene interaction models for ischemic stroke. Stat Med 23:1439–145310.1002/sim.1749 - DOI - PubMed
    1. Hansen TF, Wagner GP (2001) Modeling genetic architecture: a multilinear theory of gene interaction. Theor Popul Biol 59:61–8610.1006/tpbi.2000.1508 - DOI - PubMed
    1. Fisher RA (1918) The correlation between relatives on the supposition of Mendelian inheritance. Trans R Soc Edinb 3:399–433
    1. Cockerham CC (1954) An extension of the concept of partitioning hereditary variance for analysis of covariances among relatives when epistasis is present. Genetics 39:859–882 - PMC - PubMed
    1. Kempthorne O (1954) The correlation between relatives in a random mating population. Proc R Soc Lond B 143:103–113 - PubMed

Publication types

Substances