

Immune markers measured before treatment predict outcome of intensive phase tuberculosis therapy
- PMID: 17034576
- PMCID: PMC1942062
- DOI: 10.1111/j.1365-2249.2006.03211.x
Immune markers measured before treatment predict outcome of intensive phase tuberculosis therapy
Abstract
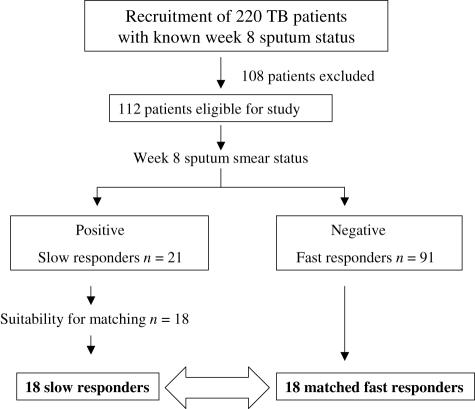
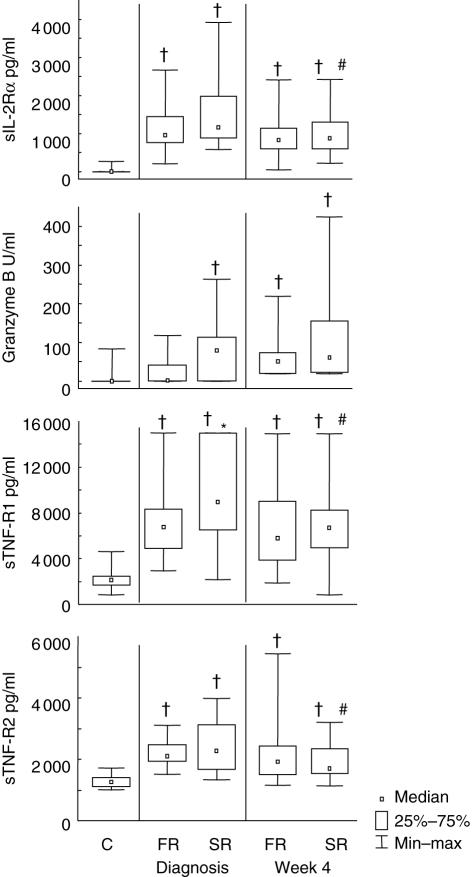
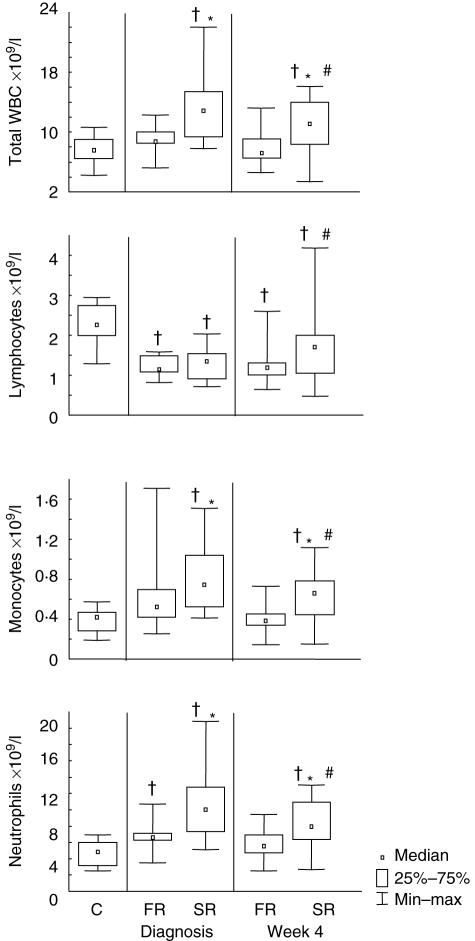
The development of a statistical model based on simple immunological markers which could predict the response to tuberculosis treatment would facilitate clinical trials of new anti-tuberculosis drugs. We have examined the ability of immunological biomarkers, measured at diagnosis and after 4 weeks of treatment, to predict sputum smear status at week 8. Eighteen tuberculosis patients with positive Ziehl-Nielsen (ZN)-stained sputum smears 8 weeks after initiation of treatment (slow response) were matched for age, gender, sputum smear grade and extent of disease on chest radiograph to 18 patients with negative sputum smears at week 8 (fast response). In addition to total white blood cell (WBC) counts and absolute lymphocyte, monocyte and neutrophil numbers, concentrations of six serum markers were measured by enzyme-linked immunosorbent assay (ELISA) in all patients (soluble interleukin-2 receptor alpha (sIL-2Ralpha), granzyme B, soluble tumour necrosis factor alpha receptors 1 and 2 (sTNF-R1 and -2), nitrotyrosine and interferon-gamma (IFN-gamma). At diagnosis, 4 biomarkers (sTNF-R1, total WBC, absolute monocyte and absolute neutrophil numbers) were significantly higher in slow response patients. At week 4, total WBC count and absolute monocyte and neutrophil numbers remained significantly higher in slow responders. Discriminant analysis of the diagnosis and week 4 data provided models for classification of slow response patients with 67% and 83% predictive accuracy. We suggest that treatment response phenotypes can be determined before the start of treatment. Reliable predictive models would allow targeted interventions for patients at risk for slow treatment response to standard tuberculosis therapy.
Figures
References
-
- Abramo C, Meijgaarden KE, Garcia D, et al. Monokine induced by interferon gamma and IFN-gamma response to a fusion protein of Mycobacterium tuberculosis ESAT-6 and CFP-10 in Brazilian tuberculosis patients. Microbes Infect. 2006;8:45–51. - PubMed
-
- Benator D, Bhattacharya M, Bozeman L, et al. Rifapentine and isoniazid once a week versus rifampicin and isoniazid twice a week for treatment of drug-susceptible pulmonary tuberculosis in HIV-negative patients: a randomised clinical trial. Lancet. 2002;360:528–34. - PubMed
-
- Enarson DE, Rieder HL, Arnadottir T, Trebucq A. France: Fifth International Union Against Tuberculosis and Lung Disease; Management of tuberculosis: a guide for low income countries. [pamphlet].
-
- The Provincial Administration of The Western Cape Metropole Region and City Health. City of Cape Town/Metropole Region TB Control Programme Progress Report 1997–2002. Available at: http://www.capegateway.gov.za/Text/2003/12/cct_tb_report_1997to2002.pdf. 2002. (Last accessed 2002)
Publication types
MeSH terms
Substances
LinkOut - more resources
Full Text Sources
Other Literature Sources
