

Signal stability of Cy3 and Cy5 on antibody microarrays
- PMID: 17034643
- PMCID: PMC1633729
- DOI: 10.1186/1477-5956-4-21
Signal stability of Cy3 and Cy5 on antibody microarrays
Abstract
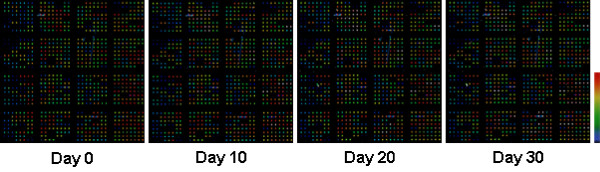
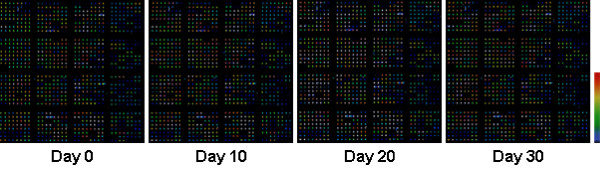
Background: The antibody microarray technique is a newly emerging proteomics tool for differential protein expression analyses that uses fluorescent dyes Cy 3 and Cy 5. Environmental factors, such as light exposure, can affect the signal intensity of fluorescent dyes on microarray slides thus, it is logical to scan microarray slides immediately after the final wash and drying processes. However, no research data are available concerning time-dependent changes of fluorescent signals on antibody microarray slides to this date. In the present study, microarray slides were preserved at -20 degrees C after regular microarray experiments and were rescanned at day 10, 20 and 30 to evaluate change in signal intensity.
Results: Fluorescent intensities of microarray spots were detected using a confocal laser scanner after the experiment at day 0, and re-examined at day 10, 20 and 30, respectively. Fluorescent intensities of rescanned microarray spots did not show significant changes when compared with those scanned immediately after standard microarray experiments.
Conclusion: Microarray slides can be preserved and rescanned multiple times using a confocal laser scanner over a period of days or weeks.
Figures
References
-
- Perlee L, Christiansen J, Dondero R, Grimwade B, Lejnine S, Mullenix M, Shao W, Sorette M, Tchernev V, Patel D, Kingsmore S. Development and standardization of multiplexed antibody microarrays for use in quantitative proteomics. Proteome Sci. 2004;2:9. doi: 10.1186/1477-5956-2-9. - DOI - PMC - PubMed
Grants and funding
LinkOut - more resources
Full Text Sources
Other Literature Sources
