. 2007 Jan 1;34(1):44-60.
doi: 10.1016/j.neuroimage.2006.08.030. Epub 2006 Oct 10.

3D pattern of brain atrophy in HIV/AIDS visualized using tensor-based morphometry

Affiliations

3D pattern of brain atrophy in HIV/AIDS visualized using tensor-based morphometry

Ming-Chang Chiang et al. Neuroimage. .

Abstract

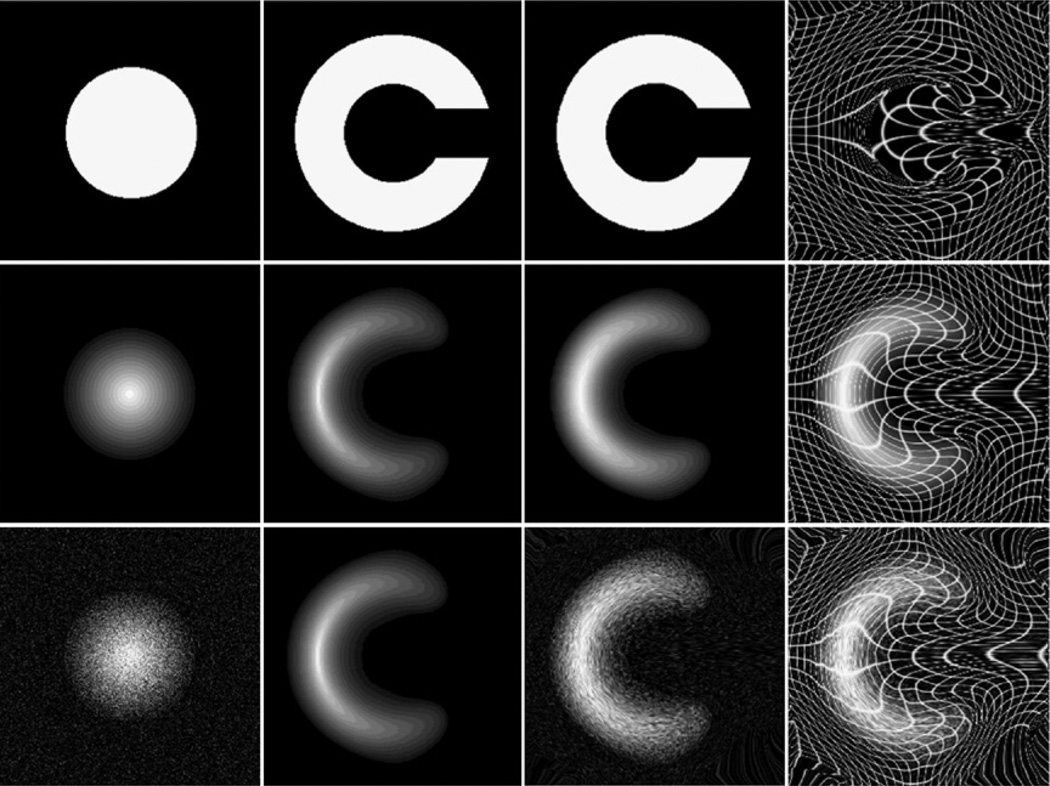
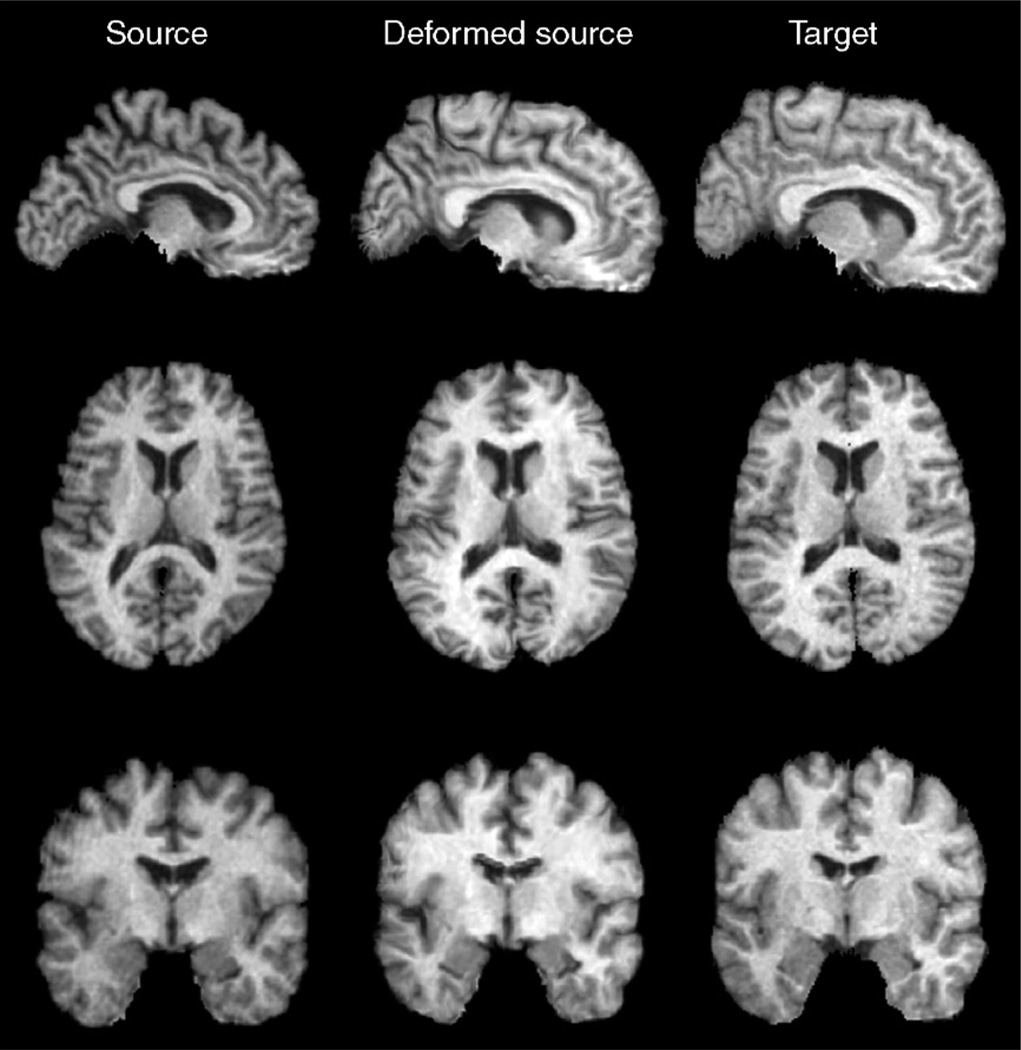
35% of HIV-infected patients have cognitive impairment, but the profile of HIV-induced brain damage is still not well understood. Here we used tensor-based morphometry (TBM) to visualize brain deficits and clinical/anatomical correlations in HIV/AIDS. To perform TBM, we developed a new MRI-based analysis technique that uses fluid image warping, and a new alpha-entropy-based information-theoretic measure of image correspondence, called the Jensen-Rényi divergence (JRD).

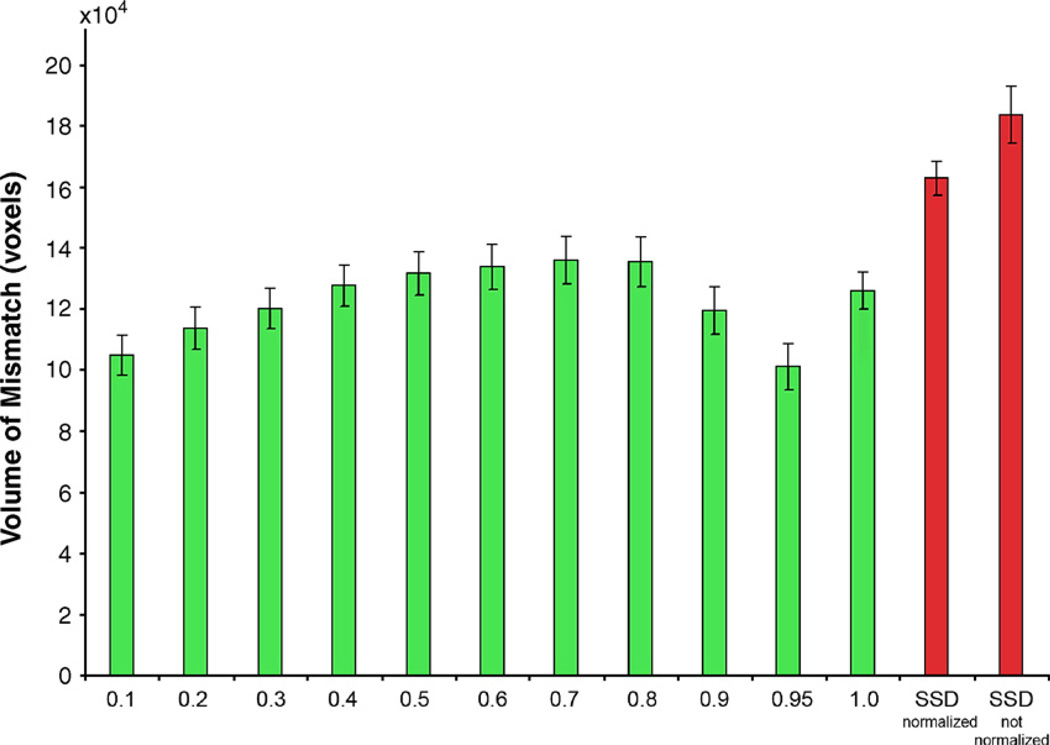
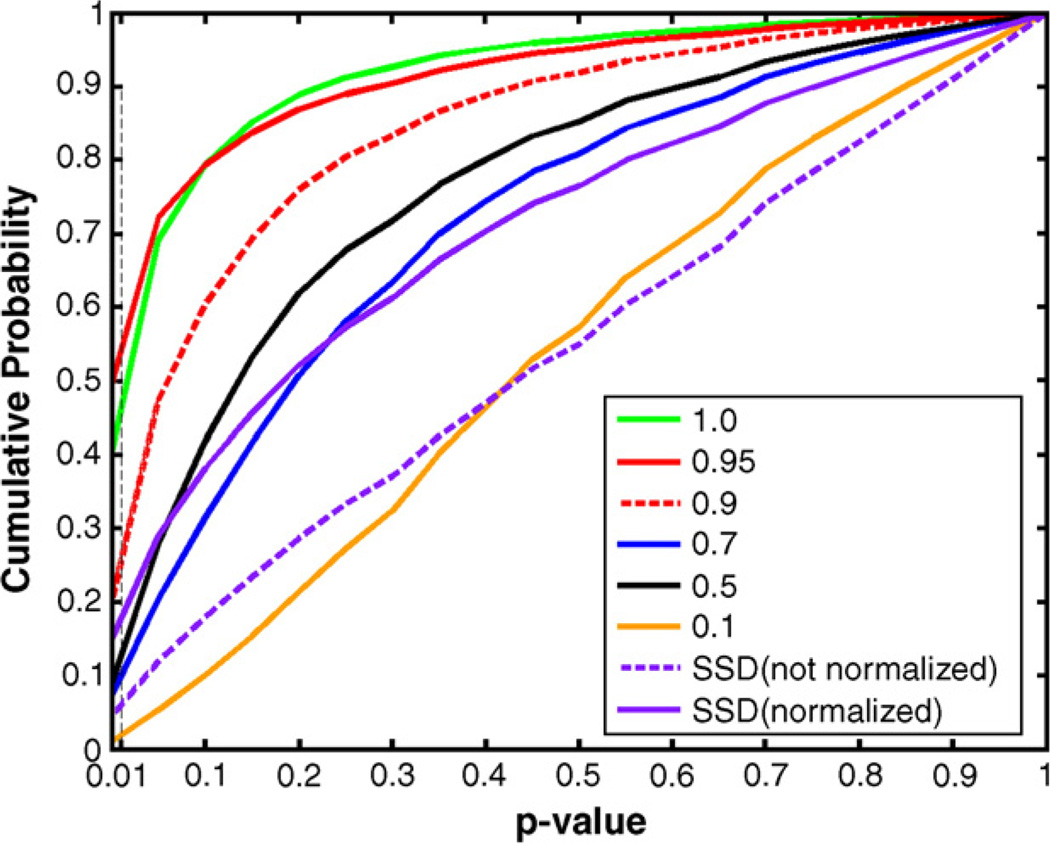
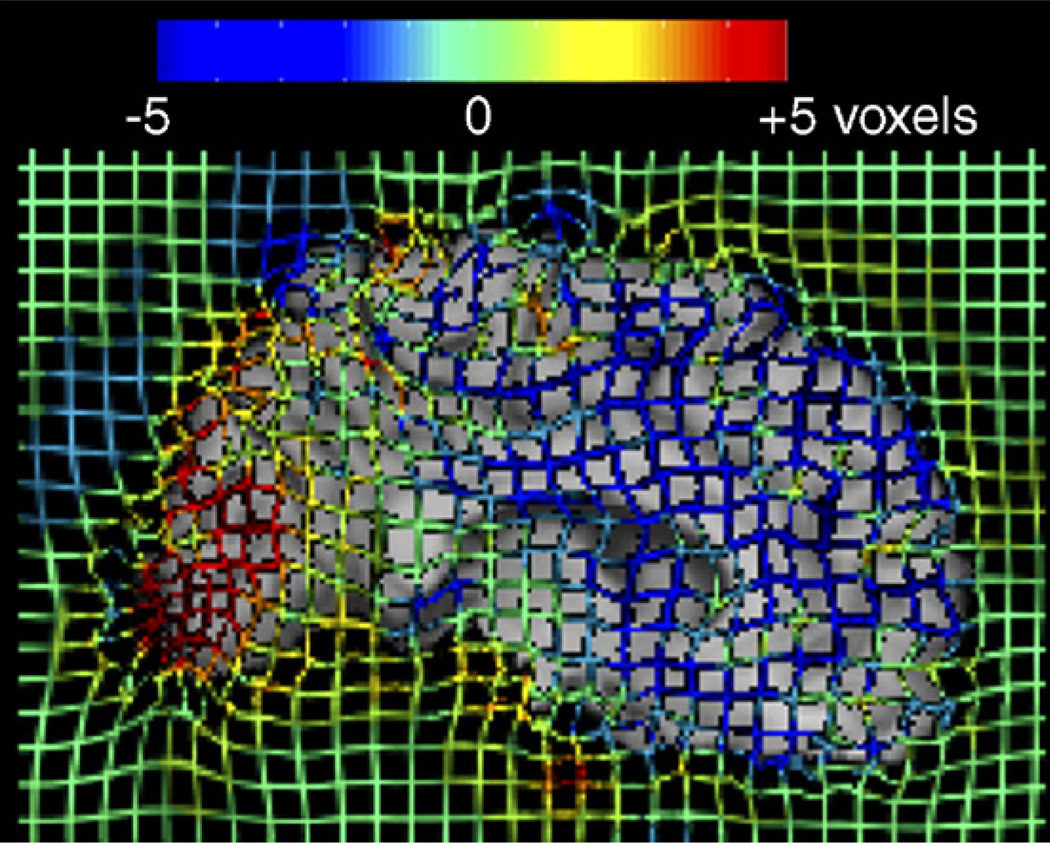
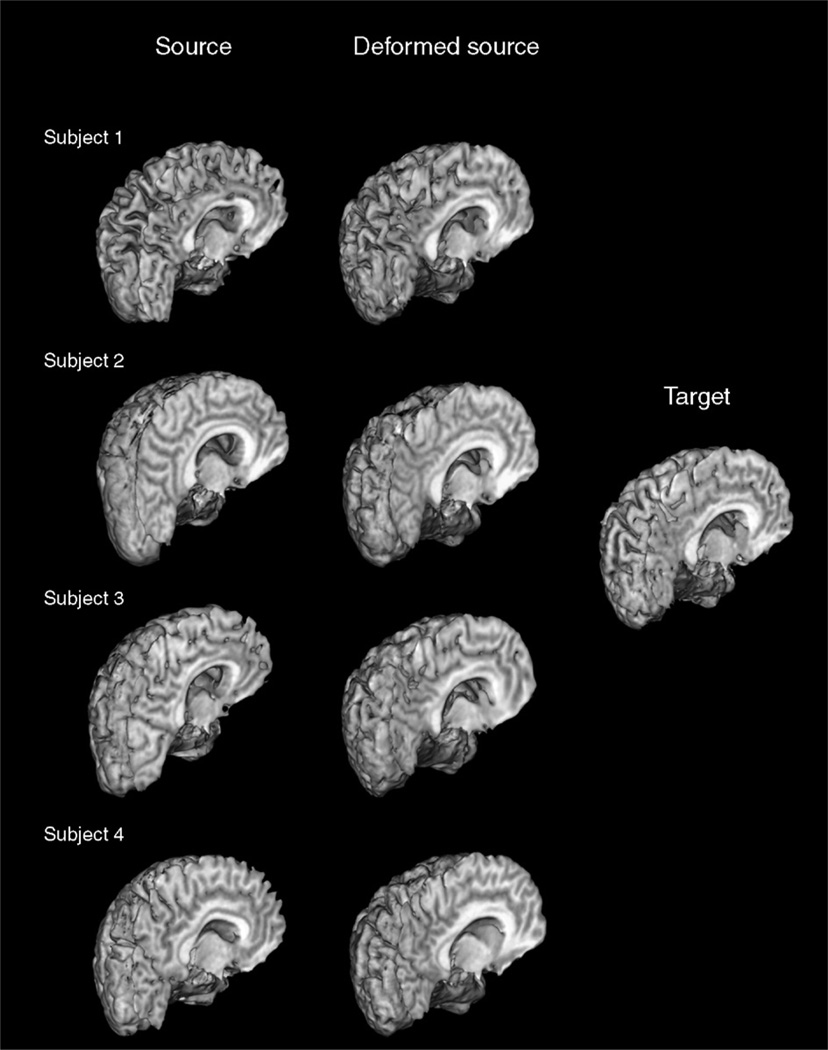
Methods: 3D T1-weighted brain MRIs of 26 AIDS patients (CDC stage C and/or 3 without HIV-associated dementia; 47.2+/-9.8 years; 25M/1F; CD4+ T-cell count: 299.5+/-175.7/microl; log10 plasma viral load: 2.57+/- 1.28 RNA copies/ml) and 14 HIV-seronegative controls (37.6+/-12.2 years; 8M/6F) were fluidly registered by applying forces throughout each deforming image to maximize the JRD between it and a target image (from a control subject). The 3D fluid registration was regularized using the linearized Cauchy-Navier operator. Fine-scale volumetric differences between diagnostic groups were mapped. Regions were identified where brain atrophy correlated with clinical measures.

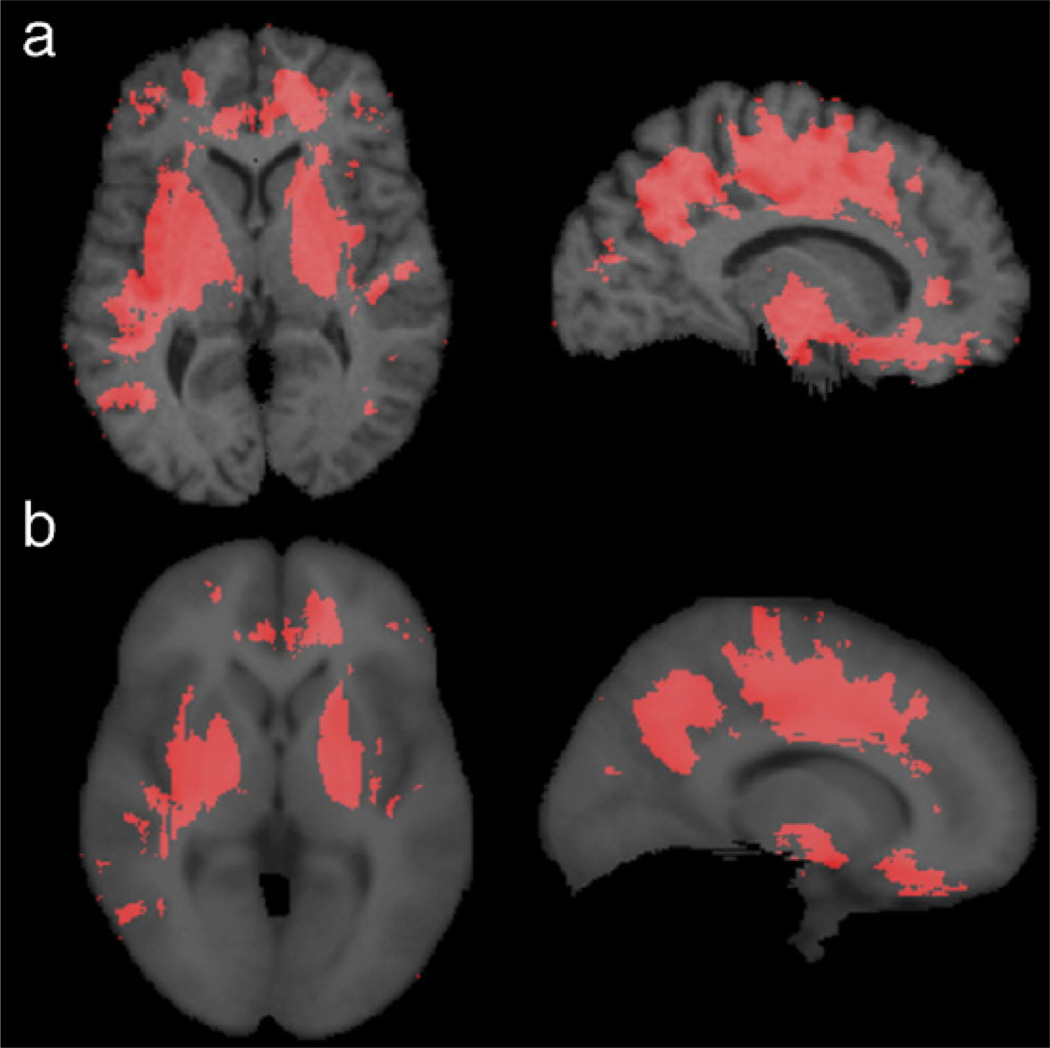
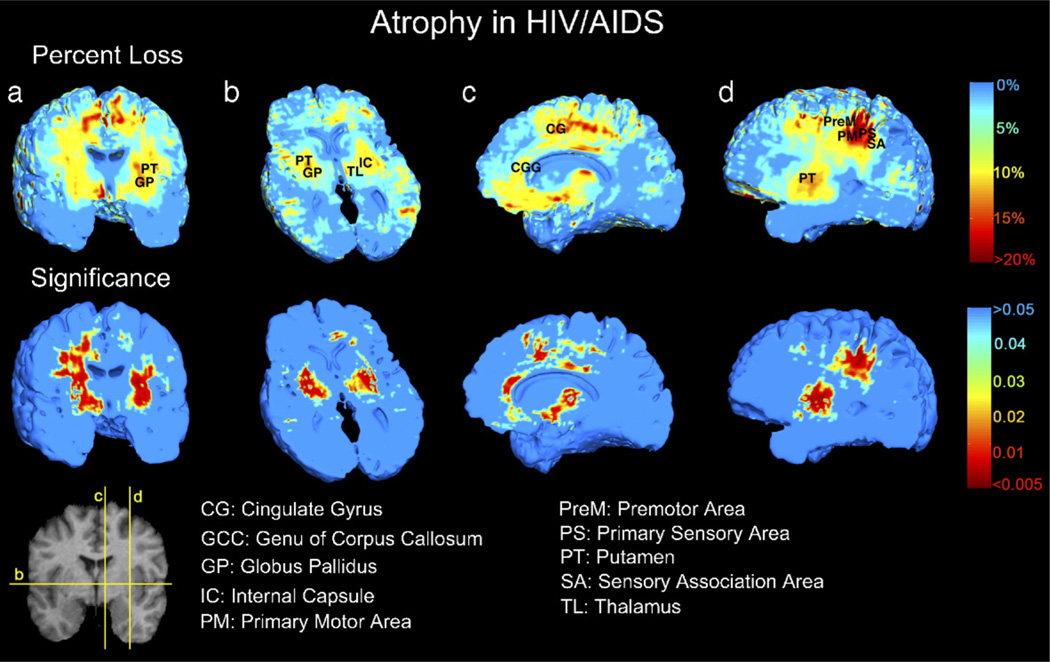
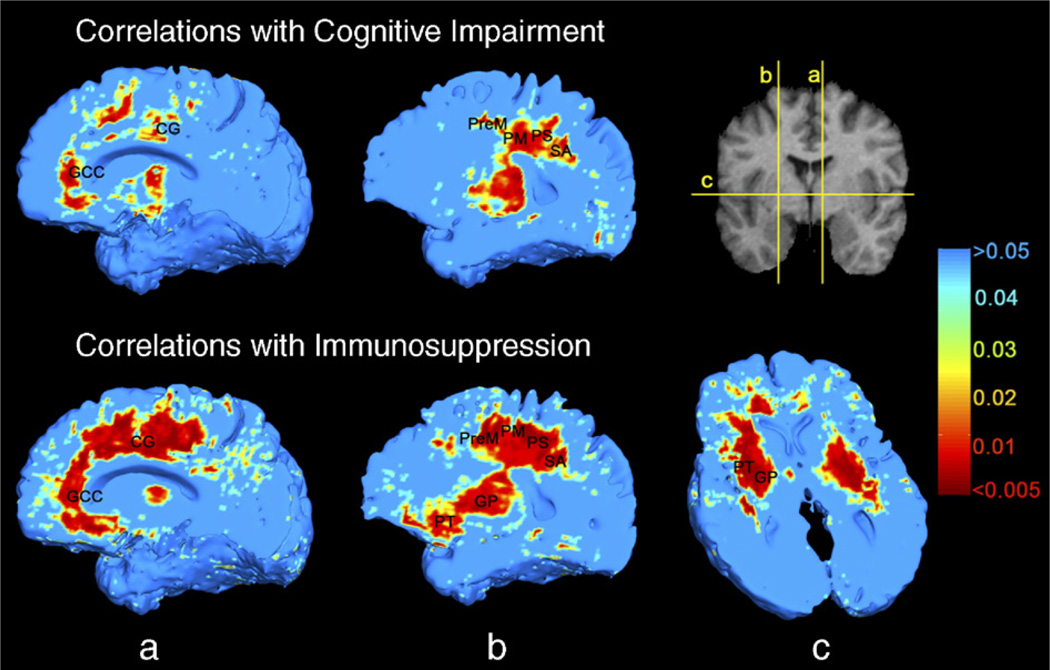
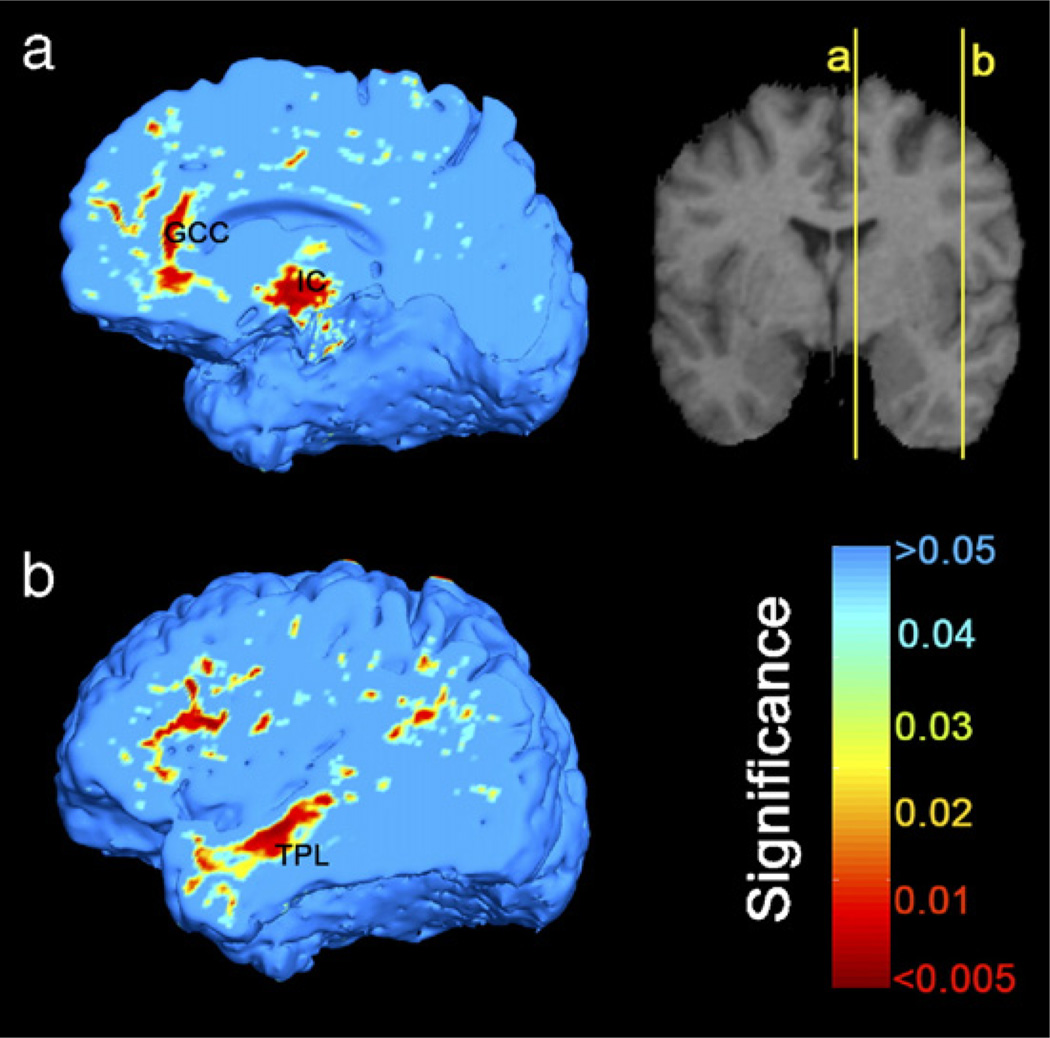
Results: Severe atrophy ( approximately 15-20% deficit) was detected bilaterally in the primary and association sensorimotor areas. Atrophy of these regions, particularly in the white matter, correlated with cognitive impairment (P = 0.033) and CD4+ T-lymphocyte depletion (P = 0.005).

Conclusion: TBM facilitates 3D visualization of AIDS neuropathology in living patients scanned with MRI. Severe atrophy in frontoparietal and striatal areas may underlie early cognitive dysfunction in AIDS patients, and may signal the imminent onset of AIDS dementia complex.


Figures

Fig. 1
Fig. 1
This figure shows significance maps computed after using (a) a single subject and (b) the average ICBM53 atlas brain as the registration target image, based on applying the Mann–Whitney U test, at each voxel, to the difference in the mean log Jacobian determinant between AIDS and control groups. Only voxels with P < 0.01 are displayed (red). Although using an average brain image as the target avoids the bias toward the particular geometry of a single subject, it led to (slightly) lower effect sizes. This is apparent in the subcortical gray matter where the intensity contrast with the surrounding white matter is lower in the average brain. However, the results using each template are very similar in their overall spatial extent and distribution. Template optimization for TBM, e.g., using “minimal deformation targets” (MDT) (Kochunov et al., 2002), and geodesic mean templates (Avants and Gee, 2004; Fletcher et al., 2004) is the subject of on-going study, by our group and others.
Fig. 2
Fig. 2
Circle to “C” experiments using JRD. From left to right: source image, target image, source deformed to match target, and the deformation applied to a rectangular grid with or without the deformed source. Top row: binary images. Middle: gray-level images with the intensity of the central layer set equal to 255 and reduced by 15 layer by layer. Bottom: test images (the same as in the middle row) show good performance with Gaussian noise added to the source image (SNR=1.92 dB).
Fig. 3
Fig. 3
The volume of mismatch between the registered source and target brain MR images for different values of α in the cost functional (Jensen–Rényi divergence; green bars) used to align the images. α=1 represents the mutual information. The volume of mismatch based on minimizing the summed squared intensity differences (SSD; red bars) is plotted for reference (SSD is a simpler cost functional, often used in linear and nonlinear image registration, see, e.g., Woods et al., 1998; Ashburner and Friston, 1999 for examples in brain mapping). To allow better registration performance using SSD, prior to image deformation, intensities in the two images were scaled (i.e., intensity normalized) such that the mean intensities over the brain were the same. Although the registration accuracy based on SSD is improved after the image intensities are normalized, the performance of JRD in the 3D experiments is still better than that of SSD, at least on this dataset.
Fig. 4
Fig. 4
Comparisons of JRD at different α values and SSD (with intensity normalized or not normalized), based on the cumulative histogram of the probability maps. The probability maps were obtained from the difference of the mean log Jacobian determinant between the AIDS and control groups, using the Mann–Whitney U test. α=1 represents the mutual information. The number of voxels with statistical significance (P<0.01) is greatest at α=0.95. Although the computation time using SSD (about 10 min) is shorter than JRD (about 12 min), it is less powerful for detecting disease effects, at least in this study, using the intuitive metric of the number of significant voxels that pass a predetermined primary threshold.
Fig. 5
Fig. 5
Example of 3D registration by the JRD method. On comparison of different sections of the source, deformed source and the target images, registration using the JRD method allows good geometrical matching of the shape of gyri, corpus callosum, and ventricles. Whether cortical homology is established is a more complex issue, but the boundaries are clearly matched with much greater accuracy and boundary correspondence than prior to registration.
Fig. 6
Fig. 6
To better visualize the 3D deformation field used to drive the registration shown in Fig. 5, a colored grid was superimposed on the registered image. Red and blue colors represent deformation orthogonal to the midsagittal plane of the brain (out of the page).
Fig. 7
Fig. 7
3D surfaces of the source, deformed source and the target brain images in several subjects, showing that the gyri, ventricles, and corpus callosum in the source images, are deformed to match the corresponding structures in the target images.
Fig. 8
Fig. 8
Visualization of brain tissue loss in HIV/AIDS. This analysis of disease effects was performed in male subjects only to better control for any possible effects of age and gender. The ratio of the mean Jacobian determinant in AIDS to the mean Jacobian determinant in control subjects was computed voxelwise to map the 3D profile of brain tissue reduction (upper row). Bilateral local atrophy was identified in (a) the putamen, globus pallidus, (b) thalamus, and in the posterior limb of the internal capsule, along with (c) the cingulate gyrus and the genu and mid-posterior body of corpus callosum, and in (c and d) basal and medial frontal lobes. Greatest tissue loss occurs in primary motor and sensory, premotor and sensory association areas (d). Mann–Whitney U test was used to obtain the significance map (lower row).
Fig. 9
Fig. 9
Greater brain atrophy is associated with greater cognitive impairment (upper row), in middle cingulate, genu of the corpus callosum, medial and basal frontal lobes, and primary and association sensorimotor areas, tested by Spearman’s (non-parametric) rank correlation. Correlations of brain atrophy with CD4+ T-lymphocyte depletion are more extensive in the above regions, as well as in the putamen and globus pallidus (lower row). This analysis was performed within the HIV/AIDS patient group only. Abbreviations are the same as in Fig. 8.
Fig. 10
Fig. 10
In healthy subjects, brain volume decreases with aging in (a) the genu of corpus callosum (GCC), posterior limbs of internal capsule (IC) bordering on the ventrolateral thalamus, (b) anterior frontal, and lateral temporal lobes (TPL). On the other hand, such linkage was not detected in AIDS patients (maps not shown), nor was a disease × age interaction, perhaps due to small sample sizes and the relatively restricted age range.

References

    1. Arsigny V, Fillard P, Pennec X, Ayache N. Fast and simple calculus on tensors in the Log-Euclidean framework. Proceedings of the 8th Int. Conf. on Medical Image Computing and Computer-Assisted Intervention—MICCAI 2005; October 26–29; Palm Springs, CA, USA. 2005. - PubMed
    1. Ashburner J, Friston KJ. Nonlinear spatial normalization using basis functions. Hum. Brain Mapp. 1999;7(4):254–266. - PMC - PubMed
    1. Ashburner J, Friston KJ. Voxel-based morphometry—The methods. NeuroImage. 2000;11(6):805–821. - PubMed
    1. Ashburner J, Hutton C, Frackowiak R, Johnsrude I, Price C, Friston K. Identifying global anatomical differences: deformation-based morphometry. Hum. Brain Mapp. 1998;6(5–6):348–357. - PMC - PubMed
    1. Avants B, Gee JC. Geodesic estimation for large deformation anatomical shape averaging and interpolation. NeuroImage. 2004;23 Suppl. 1:S139–S150. - PubMed

Publication types