. 2006 Oct 24;103(43):16039-44.
doi: 10.1073/pnas.0607076103. Epub 2006 Oct 11.

IL-1 resets glucose homeostasis at central levels

Affiliations

IL-1 resets glucose homeostasis at central levels

Adriana Del Rey et al. Proc Natl Acad Sci U S A. .

Abstract

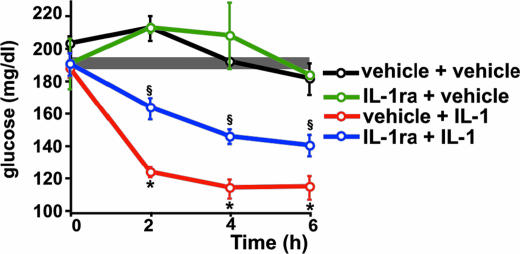
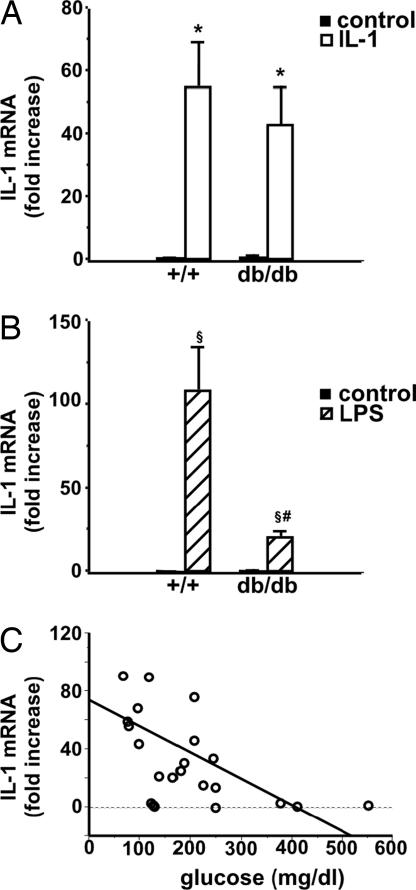
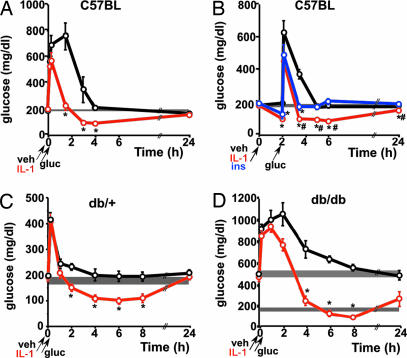
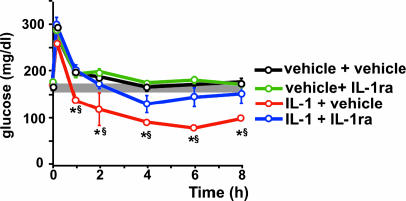
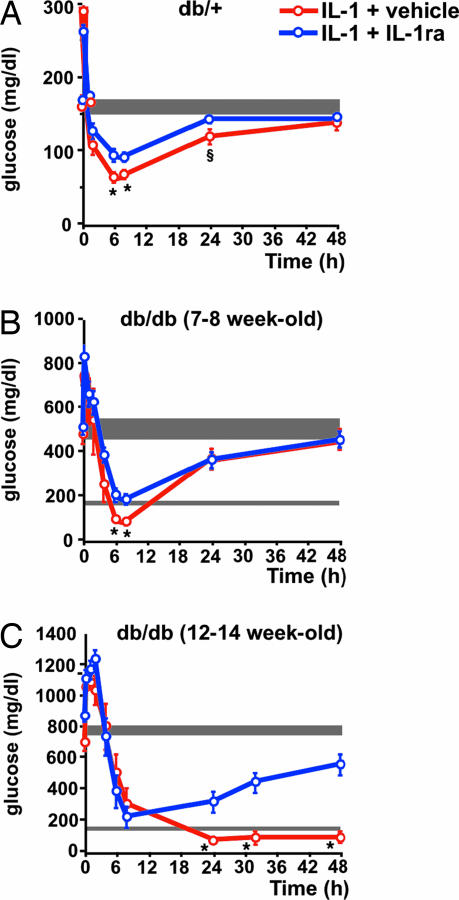
Administration of IL-1beta results in a profound and long-lasting hypoglycemia. Here, we show that this effect can be elicited by endogenous IL-1 and is related to not only the capacity of the cytokine to increase glucose uptake in peripheral tissues but also to mechanisms integrated in the brain. We show that (i) blockade of IL-1 receptors in the brain partially counteracted IL-1-induced hypoglycemia; (ii) peripheral administration or induction of IL-1 production resulted in IL-1beta gene expression in the hypothalamus of normal and insulin-resistant, leptin receptor-deficient, diabetic db/db mice; (iii) IL-1-treated normal and db/db mice challenged with glucose did not return to their initial glucose levels but remained hypoglycemic for several hours. This effect was largely antagonized by blockade of IL-1 receptors in the brain; and (iv) when animals with an advanced Type II diabetes were treated with IL-1 and challenged with glucose, they died in hypoglycemia. However, when IL-1 receptors in the brains of these diabetic mice were blocked, they survived, and glucose blood levels approached those that these mice had before IL-1 administration. The prolonged hypoglycemic effect of IL-1 is insulin-independent and develops against increased levels of glucocorticoids, catecholamines, and glucagon. These findings, together with the present demonstration that this effect is integrated in the brain and is paralleled by IL-1beta expression in the hypothalamus, indicate that this cytokine can reset glucose homeostasis at central levels. Such reset, along with the peripheral actions of the cytokine, would favor glucose uptake by immune cells during inflammatory/immune processes.


Conflict of interest statement

The authors declare no conflict of interest.

Figures

Fig. 1.
Fig. 1.
IL-1 induces hypoglycemia. (A) Immediately after a blood sample was obtained (time 0), C57BL/6J male mice received LPS (0.5 μg per mouse) or saline and, 30 min later, IL-1ra (100 μg or 300 μg) or the corresponding vehicle. All substances were injected i.p. Additional blood samples were collected at the times indicated and used for glucose determinations. Each point in the curves represents the mean ± SEM from determinations performed in four (in groups with saline) or seven (in groups with LPS) mice per group. ∗, P < 0.005 vs. saline + vehicle and vs. saline + IL-1ra; ‡, P < 0.015 vs. LPS + vehicle; #, P < 0.015 vs. saline + IL-1ra. (B) Immediately after a blood sample was obtained (time 0), mice received either the vehicle alone, IL-1 (0.1 μg per mouse), or regular insulin (0.25 units) injected i.p. Additional blood samples were collected at the times indicated. Each point in the curves represents the mean ± SEM from determinations performed in 5–10 mice per group. ∗, P < 0.01 vs. vehicle; §, P < 0.005 vs. insulin. The shaded area in each panel indicates the range of the mean ± SEM of time 0 from all groups together.
Fig. 2.
Fig. 2.
Blockade of IL-1 receptors in the brain interferes with IL-1-induced hypoglycemia. IImmediately after a blood sample was obtained (time 0), IL-1ra (50 μg in 5 μl of vehicle) or the vehicle alone was injected i.c.v., and IL-1 (0.1 μg per mouse) or the vehicle was injected i.p. Additional blood samples were collected at the times indicated and used for glucose determinations. Each point in the curves represents the mean ± SEM from determinations performed in three (in groups with control i.p) and six to eight (in groups with IL-1 i.p.) mice per group. ∗, P < 0.001 vs. control + vehicle and vs. control + IL-1ra; §, P < 0.005 vs. all other groups. The shaded area indicates the range of the mean ± SEM of time 0 from all groups together.
Fig. 3.
Fig. 3.
IL-1 and LPS induce IL-1 gene expression in the hypothalamus of normal and diabetic mice. Male C57BL/Ks +/+ and db/db mice (8 weeks of age) received control vehicle, IL-1 (0.1 μg per mouse) (A), or LPS (0.5 μg per mouse) (B) injected i.p. Animals were killed 2 h later, blood was collected, and the hypothalamus was dissected and immediately frozen until used for the determination of IL-1 gene expression as described in Materials and Methods. Each bar represents the mean ± SEM from determinations performed in three to five mice per group. (A) ∗, P < 0.05 vs. corresponding control. (B) §, P < 0.02 vs. corresponding control; #, P < 0.01 vs. LPS-injected +/+ mice. (C) The correlation between IL-1 gene expression in the hypothalamus and glucose blood levels. The data shown in A and B are plotted together with the corresponding glucose concentration determined in the blood of each individual mouse (r2 = 0.023, P < 0.02).
Fig. 4.
Fig. 4.
Effect of IL-1 on glucose (gluc) tolerance in normal and db/db mice. (A) After a blood sample was obtained, 8-week-old C57BL/6J male mice received vehicle (veh) or IL-1 (0.1 μg per mouse) injected i.p., immediately followed by glucose [2 mg/g of body weight (g b.w.)], also administered i.p. Additional blood samples were obtained at the times indicated. Each point in the curves represents the mean ± SEM from glucose determinations performed in four mice per group. ∗, P < 0.05 vs. vehicle. (B) The same procedure as described in A was followed, but the glucose load was administered 2 h after the injection of vehicle, IL-1, or regular insulin (ins). Each point in the curves represents the mean ± SEM from glucose determinations performed in five mice per group. ∗, P < 0.01 vs. vehicle; #, < P < 0.05 vs. insulin. (C) After obtaining a blood sample, C57BL/Ks db/+ mice (mean body weight, 22.4 ± 0.3 g) received either vehicle or IL-1 (0.25 μg per mouse) injected i.p., immediately followed by glucose (2 mg/g b.w.) also administered i.p. Additional blood samples were obtained at the times indicated. Each point in the curves represents the mean ± SEM from glucose determinations performed in five mice per group. ∗, P < 0.005 vs. vehicle. (D) The same procedure as described in C was followed but using C57BL/Ks db/db mice and a dose of 0.5 μg of IL-1 per mouse, because the body weight of these mice (48.3 ± 0.9 g) is approximately twice that of db/+ mice. Each point in the curves represents the mean ± SEM from glucose determinations performed in four or five mice per group. ∗, P < 0.005 vs. vehicle. The shaded area in each panel indicates the range of the mean ± SEM of time 0 from all groups together. The lower shaded area in D corresponding to the glucose range of normoglycemic db/+ mice (C) has been included for comparison.
Fig. 5.
Fig. 5.
Brain IL-1 maintains IL-1-induced-hypoglycemia even after a glucose load in normal mice. After a blood sample was obtained (time 0), C57BL/6J mice received either vehicle or IL-1 (0.1 μg per mouse) injected i.p. and either vehicle or IL-1ra (50 μg in 5 μl of vehicle) injected i.c.v. Immediately after injection, a glucose load (2 mg/g b.w.) was administered i.p. Additional blood samples were collected at the times indicated and used for glucose determinations. Each point in the curves represents the mean ± SEM from determinations performed in three to six mice per group. ∗, P < 0.001 vs. control + saline and control + IL-1ra; §, P < 0.05 vs. IL-1 + IL-1ra. The shaded area indicates the range of the mean ± SEM of time 0 from all groups together.
Fig. 6.
Fig. 6.
Brain IL-1 maintains IL-1-induced-hypoglycemia after a glucose load in db/db mice. (A) After a blood sample was obtained (time 0), C57BL/Ks db/+ mice received IL-1 (0.1 μg per mouse) injected i.p. and either vehicle or IL-1ra (50 μg in 5 μl of vehicle) injected i.c.v. Immediately after injection, a glucose load (2 mg/g b.w.) was administered i.p. Additional blood samples were collected at the times indicated in the curves and used for glucose determinations. Each point in the curves represents the mean ± SEM from determinations performed in six mice per group. ∗, P < 0.025 vs. IL-1 + IL-1ra-injected mice; §, P < 0.025 vs. time 0. (B) The same procedure and doses of IL-1, IL-1ra, and glucose as in A but using 7- to 8-week-old C57BL/Ks db/db mice. Each point in the curves represents the mean ± SEM from determinations performed in six or seven mice per group. ∗, P < 0.025 vs. IL-1 + IL-1ra-injected mice. (C) The same procedure and doses of IL-1, IL-1ra, and glucose as in A but using 12- to 14-week-old C57BL/Ks db/db mice. Each point in the curves represents the mean ± SEM from determinations performed in six mice per group. ∗, P < 0.01 vs. IL-1 + IL-1ra-injected mice. The shaded area in each panel indicates the range of the mean ± SEM of time 0 from all groups together.

Similar articles

Cited by

References

    1. Riedemann NC, Guo RF, Ward PA. J Clin Invest. 2003;112:460–467. - PMC - PubMed
    1. Powanda MC, Beisel WR. J Nutr. 2003;133:S322–S327. - PubMed
    1. Bachmann MF, Kopf M. Curr Opin Immunol. 2002;14:413–419. - PubMed
    1. Straub RH, Besedovsky HO. Faseb J. 2003;17:2176–2183. - PubMed
    1. Calder PC. Proc Nutr Soc; 1995. pp. 65–82. - PubMed

Publication types

Associated data

LinkOut - more resources