Comparative Study
. 2006 Oct 11;26(41):10438-51.
doi: 10.1523/JNEUROSCI.1025-06.2006.

The transcription factor six1 inhibits neuronal and promotes hair cell fate in the developing zebrafish (Danio rerio) inner ear

Affiliations
Comparative Study

The transcription factor six1 inhibits neuronal and promotes hair cell fate in the developing zebrafish (Danio rerio) inner ear

Olivier Bricaud et al. J Neurosci. .

Abstract

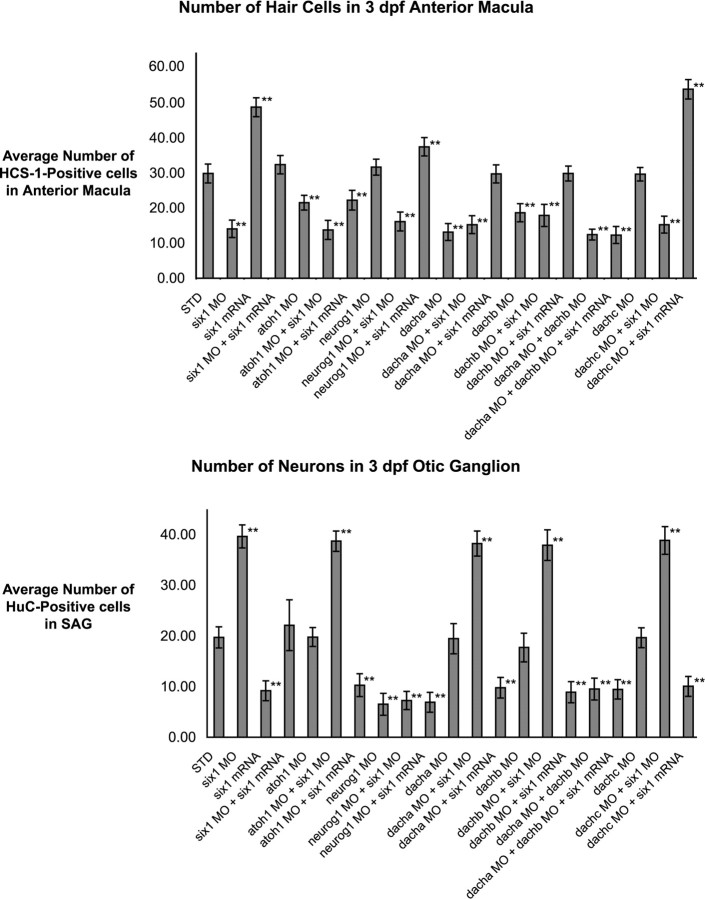
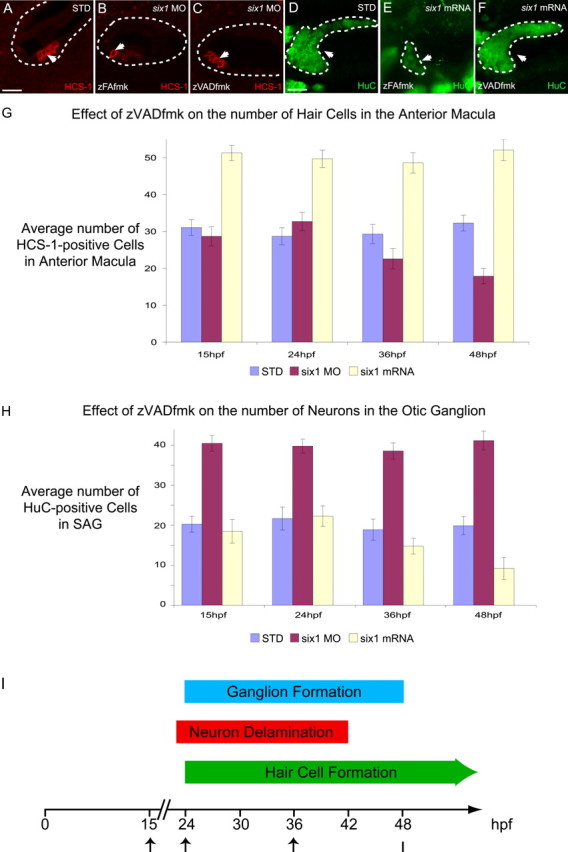
The developmental processes leading to the differentiation of mechanosensory hair cells and statoacoustic ganglion neurons from the early otic epithelium remain unclear. Possible candidates include members of the Pax-Six-Eya-Dach (paired box-sine oculis homeobox-eyes absent-dachshund) gene regulatory network. We cloned zebrafish six1 and studied its function in inner ear development. Gain- and loss-of-function experiments show that six1 has opposing roles in hair cell and neuronal lineages. It promotes hair cell fate and, conversely, inhibits neuronal fate by differentially affecting cell proliferation and cell death in these lineages. By independently targeting hair cells with atoh1a (atonal homolog 1a) knockdown or neurons with neurog1 (neurogenin 1) knockdown, we showed that the remaining cell population, neurons or hair cells, respectively, is still affected by gain or loss of six1 function. six1 interacts with other members of the Pax-Six-Eya-Dach regulatory network, in particular dacha and dachb in the hair cell but not neuronal lineage. Unlike in mouse, six1 does not appear to be dependent on eya1, although it seems to be important for the regulation of eya1 and pax2b expression in the ventral otic epithelium. Furthermore, six1 expression appears to be regulated by pax2b and also by foxi1 (forkhead box I1) as expected for an early inducer of the otic placode. Our results are the first to demonstrate a dual role for a member of the Pax-Six-Eya-Dach regulatory network in inner ear development.


Figures

Figure 1.
Figure 1.
Expression of six1 mRNA during zebrafish embryogenesis. A–J, Whole-mount in situ hybridization of six1 full-length cDNA probe in zebrafish embryos at 16.5 hpf (A, B), 19 hpf (C, D), 24 hpf (E, F), 32 hpf (G, H), 48 hpf (I), and 72 hpf (J). Position of otic placode or vesicle is noted by a white arrow in A, C, E, and J and surrounded by a dashed line in B, D, and F–I. Dotted lines in B, D, and F indicate the lumen of the otic vesicle. Arrows in F–I point to the six1-expressing cells in the ventral otic epithelium. Note that six1 expression is stronger in the anteriormost (G) and medialmost (H) parts of the ventral otic epithelium. White arrowhead in E points to the developing otic ganglion. Arrowheads in F–I point to cells delaminating from the ventral otic epithelium. Stars in G and I indicate the position of the otic ganglion. The arrowhead in C and the black arrow in E point to the anteroventral edge of the head, possibly the pituitary. The black arrowhead in E points to six1 expression in the posterior lateral line primordium. The arrowheads in J point to lateral line neuromasts. The inset in J represents a larger magnification of a neuromast (surrounded by a dashed line), with the centralmost cells (possibly the hair cells) expressing six1. All panels are lateral views with anterior to the left, except for A, which is an anterodorsal view, and H, which is a dorsal view with medial to the top. a, Anterior lateral line; o, olfactory placodes; p, posterior lateral line; t, trigeminal placode. Scale bars: B, D, F–I, 30 μm; A, E, 400 μm; C, 350 μm; J, 450 μm.
Figure 2.
Figure 2.
Average number of hair cells and neurons in 3 dpf anterior maculae or SAG. Hair cells and neurons have been detected by HCS-1 and HuC, respectively, using confocal microscopy. Values represent mean ± SD cell counts with a sample size of 20 anterior maculae for the hair cell counts and 15 SAG for the neuron counts. Statistical analysis was performed with Student’s t test; all comparisons were made with embryos injected with standard MO control (STD). **p < 0.005.
Figure 3.
Figure 3.
Effects of six1 loss- and gain-of-function in the developing inner ear are complementary, differentially affecting hair cells and neurons. HCS-1 immunostaining of hair cells in 3 dpf embryos injected with standard MO control (A), six1-MO (F), and six1 mRNA (K) and 28 hpf embryos with standard MO control (B), six1-MO (G), and six1 mRNA (L) is shown. HuC immunostaining of neurons in 3 dpf embryonic otic ganglia injected with standard MO control (C), six1-MO (H), and six1 mRNA (M) is shown. The white boxes in C, H, and M outline otic ganglion neurons magnified in D, I, and N, respectively. Whole-mount in situ hybridization to neuroD in 32 hpf embryos injected with standard MO control (E), six1-MO (J), and six1 mRNA (O) is shown. Whole-mount in situ hybridization to neurog1 in 26 hpf embryos injected with standard MO control (P), six1-MO (Q), and six1 mRNA (R) is shown. All panels are lateral views with anterior to the right, except A, F, and K, which are dorsal views. Arrows point to hair cells in A, B, F, G, K, L and to SAG neurons in C, D, H, I, M, N. White dashed lines in B, C, E, G, H, J, L, M, O, P, Q, and R outline the otic vesicle. The area surrounded by a black line in E, J, and O is the same in all three panels and shows the difference in the size of neuroD expression. The changes in expression levels have been confirmed in at least 30 embryos for each marker and time point. ad, Anterodorsal lateral line ganglion; av, anteroventral lateral line ganglion; f, facial epibranchial ganglion; g, glossopharyngeal epibranchial ganglion; o, octaval/statoacoustic ganglion precursors; p, posterior lateral line placode/ganglion; t, trigeminal ganglion; v, vagal epibranchial placode/ganglion. Scale bar, 10 μm. t/ad/av/f, Trigeminal/anterodorsal lateral line/anteroventral lateral line/facial epibranchial ganglion complex
Figure 4.
Figure 4.
Average number of neurons in 3 dpf cranial ganglia after six1 loss-of-function (six1 MO) or gain-of-function (six1 mRNA). Neurons labeled with HuC were scored using confocal microscopy. Values represent mean ± SD cell counts with a sample size of 20 embryos, except for the values for the otic ganglion, which have been taken from Figure 2. All comparisons were made with embryos injected with standard (STD) MO control. o, Otic ganglion; t/ad/av/f, trigeminal/anterodorsal lateral line/anteroventral lateral line/facial epibranchial ganglion complex; g, glossopharyngeal epibranchial ganglion; v, vagal epibranchial ganglion; m, middle lateral line ganglion; p, posterior lateral line ganglion. **p < 0.005.
Figure 5.
Figure 5.
A–F, Analysis of cell proliferation (A–C) and cell death (D–F) in the otocyst of 32 hpf embryos injected with standard-MO control (A, D), six1-MO (B, E), and six1 mRNA (C, F). Lateral views of otocyst immunostained for the mitosis marker phospho-histone H3 (A–C) and the cell death marker activated caspase-3 (D–F). Otic vesicle is outlined by a dashed line. Scale bar, 30 μm. G, Quantification of cell proliferation and death in injected and non-injected otocysts at 24, 32, and 48 hpf. Values are mean ± SD cell counts of cells labeled with either phospho-histone H3 or activated caspase-3, sample size of 10 embryos for each experiment. Statistical analysis was with Student’s t test; all comparisons were made with embryos injected with standard MO control. For all three time points, the number of cells counted in both six1-MO- and six1 mRNA-injected embryos are significantly higher than controls (p < 0.05). Only labeled cells within the otocyst were counted.
Figure 6.
Figure 6.
Effects of six1 perturbation on hair cell proliferation. Zn1 (hair cell marker in green) and BrdU (in red) staining in the anterior macula of 3 dpf zebrafish injected with standard-MO control (A, D, G, J, M, P), six1-MO (B, E, H, K, N, Q), and six-1 mRNA (C, F, I, L, O, R). Arrows point to Zn1-positive cells that have incorporated BrdU. Arrowheads point to Zn1-positive cells that have not incorporated any BrdU. A–I, Transverse cryosections. J–R, Frontal cryosections through six different embryos. The orientation and the planes of section are shown on the schematic of a 3 dpf embryo in S. The dashed lines in A–I outline the lumen of the otic vesicle (o). am, Anterior macula; Ant., anterior; Dors., dorsal; Lat., lateral; Med., median; Post., posterior. Scale bar, 5 μm.
Figure 7.
Figure 7.
Effects of six1 perturbation on neuronal proliferation. HuC (neural marker in red) and BrdU (in green) coimmunostaining in the SAG of 3 dpf zebrafish injected with standard-MO control (A, D, G), six1-MO (B, E, H), and six1 mRNA (C, F, I) on transverse cryosections. Both are nuclear markers. Arrows and arrowheads in A, B, D, E, G, and H point to BrdU-labeled SAG neurons and to SAG neurons that have not incorporated BrdU, respectively. Arrows and arrowheads in C, F, and I point to SAG neurons that have not incorporated BrdU and to a BrdU-positive cell that is not an SAG neuron, respectively. The orientation and plane of section are shown on the schematic of a 3 dpf embryo in J. The dashed lines outline the outer part of the otic vesicle (ov). Ant., Anterior; Dors., dorsal; Med., median; sag, statoacoustic ganglion. Scale bar, 10 μm.
Figure 8.
Figure 8.
Caspase-3 inhibitor can rescue the phenotype of six1 loss- and gain-of-function. A–C, HCS-1 immunostaining of hair cells in 3 dpf embryos, untreated standard-MO control (A), treated with zFAfmk and six1-MO (B), and treated with zVADfmk and six1-MO (C). D–F, HuC immunostaining of SAG neurons in 3 dpf embryos, untreated standard-MO control (D), treated with zFAfmk and overexpressing six1 (E), treated with zVADfmk and overexpressing six1 (F). The zVADfmk compound is a caspase-3 inhibitor, whereas zFAfmk, a structurally similar cathepsin B inhibitor, was used as a negative control. The otocyst is outlined by a dashed line in A–C. Arrows are pointing to anterior macula hair cells in A–C (confocal optical section through macula) and to SAG neurons, which are also surrounded by a white dashed line in D–F (confocal projection). Scale bars: A–C, 40 μm; D–F, 30 μm. G, H, Mean number of HCS-1-positive hair cells in 3 dpf anterior macula (G) or HuC-positive neurons in 3 dpf SAG (H) of STD, six1 MO, and six1 mRNA-injected embryos treated with zVADfmk until 72 hpf beginning at 15, 24, 36, or 48 hpf with a sample size of 15 for each condition. I, Summary timeline of ganglion formation, neuron delamination, and hair cell formation in the zebrafish inner ear. The arrows mark the time points at which zVADfmk application was begun in our experiments.
Figure 9.
Figure 9.
six1 acts via two of the three dach genes to promote the proliferation of hair cell progenitors but not SAG neurons. A–F, Whole-mount in situ hybridization to dacha (A, D), dachb (B, E), and dachc (C, F) in otocysts of STD (A–C) and six1-MO (D–F) injected embryos. All stainings have been performed at 28 hpf except B and E, which were performed at 32 hpf. Arrowheads point to ventral expression of dacha (A, D), dachb (B, E), and dachc (C, F). The changed expression was confirmed in at least 21 of 25 embryos scored. Arrows in A and D point to dorsal expression of dacha. G–M, HCS-1 immunostaining of hair cells in STD (G), six1-MO (H), dacha-MO (I), dachb-MO (J), six1-MO/dacha-MO (K), six1-MO/dachb-MO (L), and dachc-MO (M) injected 3 dpf embryos. N–Q, Whole-mount in situ hybridization to six1 in otocysts of STD control (N), dacha-MO (O), dachb-MO (P), and dachc-MO (Q) injected 28 hpf embryos. Arrowheads point to six1 expression in SAG; arrows point to six1 expression in the ventral otic epithelium. At least 30 embryos for each condition have been scored for six1 expression. All panels are lateral views with anterior to left and dorsal up, except for G–M, which are dorsal views with medial to the top. The otocyst is outlined by a dashed line in A–F and N–Q. Scale bars: A–F, N–Q, 15 μm; G–M, 5 μm.
Figure 10.
Figure 10.
Effect of six1 loss-of-function on the expression of pax2a, pax2b, eya1, and atoh1a in the developing inner ear. A–H, Whole-mount in situ hybridization to pax2a (A, B), pax2b (C, D), eya1 (E, F), and atoh1a (G, H) in otocysts of embryos injected with standard-MO control (A, C, E, G) and six1-MO (B, D, F, H). All stainings have been performed on 28 hpf embryos except for A and B, which are 36 hpf embryos, and G and H, which are 32 hpf embryos. Otic vesicle is outlined by a dashed line. Arrows point to pax2a (A, B) and pax2b (C, D) expression sites in the ventral epithelium. The arrowheads in A and B point to pax2a expression in the dorsal epithelium. The arrow in E points to same part of otocyst as in F, indicating the posterior limit of eya1 expression in a wild-type otic vesicle. The arrows in G and H indicate the normal site of atoh1a expression in the developing anterior macula. The changed expression was confirmed in at least 28 of 32 embryos scored. All panels are lateral views with anterior to the left. Scale bar, 10 μm.
Figure 11.
Figure 11.
Effect of pax2a, pax2b, eya1, pax8, and foxi1 loss-of-function on the expression of six1. A–F, Whole-mount in situ hybridization of six1 in otocysts of 28 hpf embryos injected with STD (A), pax2a-MO (B), pax2b-MO (C), eya1-MO (D), pax8-MO (E), and foxi1-MO (F). Arrows point to six1 expression in the ventral epithelium of the otic vesicle. The star in F indicates the position where the ear should form. The changed expression was confirmed in at least 25 of 30 embryos scored for each condition. All panels are lateral views with anterior to the left. Otocysts are outlined by a dashed line. Scale bar, 10 μm.

References

    1. Andermann P, Ungos J, Raible DW. Neurogenin1 defines zebrafish cranial sensory ganglia precursors. Dev Biol. 2002;251:45–58. - PubMed
    1. Appel B, Eisen JS. Regulation of neuronal specification in the zebrafish spinal cord by Delta function. Development. 1998;125:371–380. - PubMed
    1. Baker CV, Bronner-Fraser M. Vertebrate cranial placodes. I. Embryonic induction. Dev Biol. 2001;232:1–61. - PubMed
    1. Bermingham NA, Hassan BA, Price SD, Vollrath MA, Ben-Arie N, Eatock RA, Bellen HJ, Lysakowski A, Zoghbi HY. Math1: an essential gene for the generation of inner ear hair cells. Science. 1999;284:1837–1841. - PubMed
    1. Bessarab DA, Chong SW, Korzh V. Expression of zebrafish six1 during sensory organ development and myogenesis. Dev Dyn. 2004;230:781–786. - PubMed

Publication types

MeSH terms