Comparative Study
. 2006 Oct 11;26(41):10480-7.
doi: 10.1523/JNEUROSCI.3231-06.2006.

Acute impairment of mitochondrial trafficking by beta-amyloid peptides in hippocampal neurons

Affiliations
Comparative Study

Acute impairment of mitochondrial trafficking by beta-amyloid peptides in hippocampal neurons

Yanfang Rui et al. J Neurosci. .

Abstract

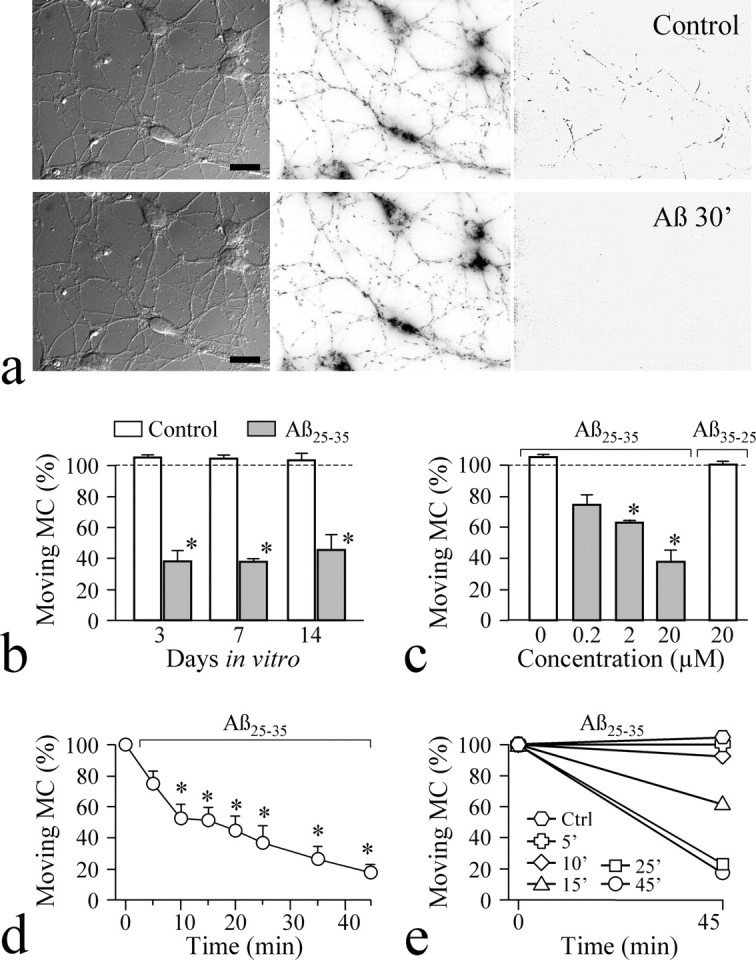
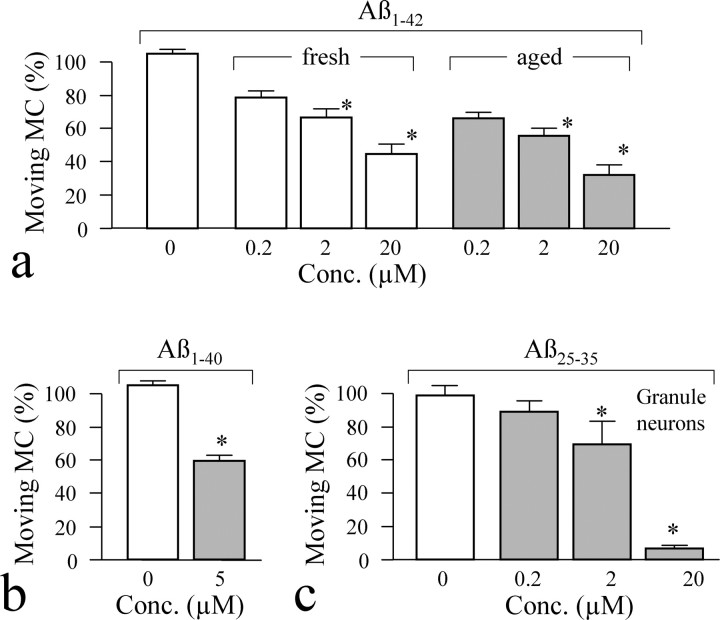
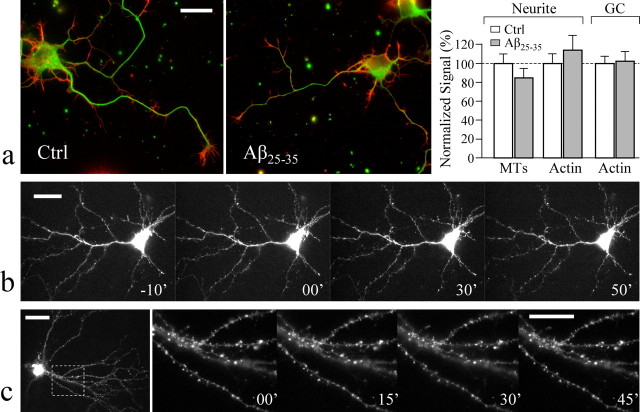
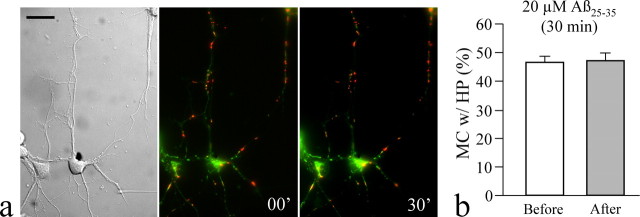
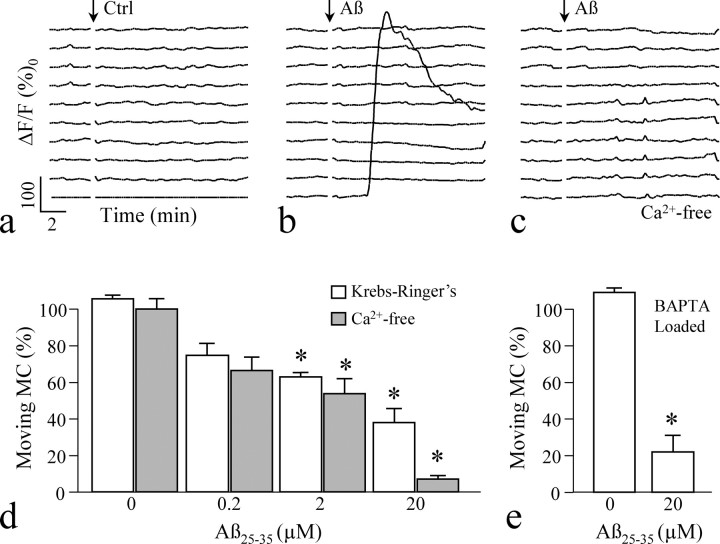
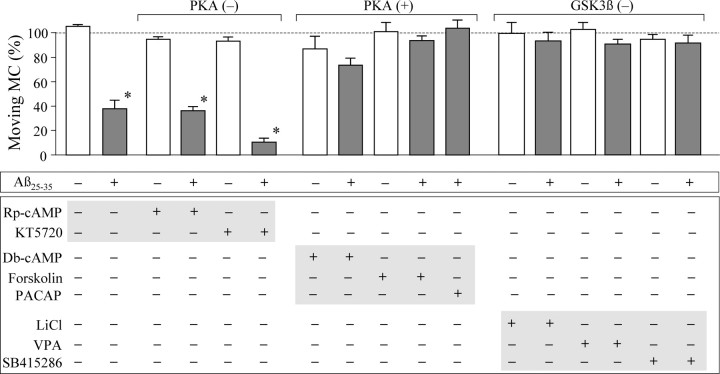
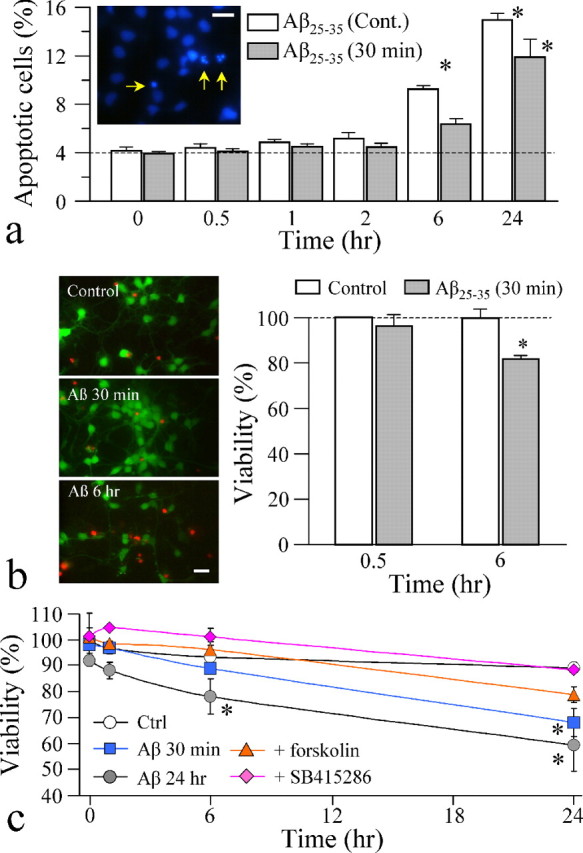
Defects in axonal transport are often associated with a wide variety of neurological diseases including Alzheimer's disease (AD). Beta-amyloid (Abeta) is a major component of neuritic plaques associated with pathological conditions of AD brains. Here, we report that a brief exposure of cultured hippocampal neurons to Abeta molecules resulted in rapid and severe impairment of mitochondrial transport without inducing apparent cell death and significant morphological changes. Such acute inhibition of mitochondrial transport was not associated with a disruption of mitochondria potential nor involved aberrant cytoskeletal changes. Abeta also did not elicit significant Ca2+ signaling to affect mitochondrial trafficking. However, stimulation of protein kinase A (PKA) by forskolin, cAMP analogs, or neuropeptides effectively alleviated the impairment. We also show that Abeta inhibited mitochondrial transport by acting through glycogen synthase kinase 3beta (GSK3beta). Given that mitochondria are crucial organelles for many cellular functions and survival, our findings thus identify an important acute action of Abeta molecules on nerve cells that could potentially contribute to various abnormalities of neuronal functions under AD conditions. Manipulation of GSK3beta and PKA activities may represent a key approach for preventing and alleviating Abeta cytotoxicity and AD pathological conditions.


Figures

Figure 1.
Figure 1.
Acute Aβ impairment of mitochondrial transport in cultured neurons. a, Representative images in differential interference contrast of hippocampal neurons (left panels), their mitochondria (middle panels), and the movement traces (right panels) before (top row) and after (bottom row) 30 min Aβ25–35 treatment. For clarity, the fluorescent images were displayed in reversed grayscales. Scale bars, 10 μm. b, Percentages of moving mitochondria remaining after 30 min treatment of 3, 7, and 14 DIV cells with control saline (Control) and Aβ25–35. c, Dose dependence of Aβ25–35 inhibition of mitochondrial transport. The reserve peptide Aβ35–25 (20 μm) was the control. d, Time course of Aβ25–35 inhibition of mitochondrial movement in 3 DIV hippocampal cells. e, Exposure time of Aβ25–35 required for inhibition of mitochondrial transport. Cells (3 DIV) were incubated with 20 μm25–35 for various periods of time, followed by washout and imaging before and 45 min after the beginning of Aβ application. Ctrl, Control; MC, mitochondria. Error bars indicate SEM. *p < 0.01, significant difference from corresponding control (Student's t test).
Figure 2.
Figure 2.
Acute impairment of mitochondrial trafficking by other Aβ fragments. a, Inhibition of mitochondrial transport by different concentrations of either freshly prepared Aβ1–42 (mostly monomers) or aged Aβ1–42 (fibrils). The percentages of moving mitochondria were scored from time-lapse sequences. b, A significant decrease in mitochondrial transport was observed when hippocampal cells were incubated for 30 min with 5 μm1–40 (aged). c, Inhibition of mitochondrial transport in cerebellar granule neurons by Aβ25–35. *p < 0.01, significant difference from the corresponding control (Student's t test). Error bars indicate SEM. MC, Mitochondria; Conc., concentration.
Figure 3.
Figure 3.
Aβ effects did not involve aberrant changes in the cytoskeleton. a, Double-immunofluorescent labeling of cultured hippocampal neurons with and without exposure to Aβ25–35 indicates no change in the cytoskeleton. The representative fluorescent images of a control and an Aβ-exposed hippocampal 3 DIV neuron are shown in the left two panels (green, microtubules; red, F-actin). Results of quantitative measurements of the fluorescent intensities of F-actin (Actin) and microtubules (MTs) along the neurite or at the growth cone (GC) are shown in the bar graph on the right. No difference was observed between the control (Ctrl) and the Aβ25–35-treated groups (p > 0.1, Student's ttest). b, c, Live fluorescence images of GFP–actin in hippocampal neurons before and after Aβ treatment. Hippocampal neurons were transfected with a GFP–γ-actin construct (in pCS2+ vector) using the calcium phosphate method (Kohrmann et al., 1999) 24 h before imaging. The time-lapse sequences of a 3 DIV hippocampal neuron (b) and a 14 DIV neuron (c) expressing GFP–actin before and after 20 μm25–35 show no changes in the morphology and branching (b) and dendritic spines (c). In c, the first image was acquired at low magnification using a 40× lens. The boxed region was then imaged at a higher magnification using a 100× lens. The digits indicate minutes before and after Aβ application. Scale bars, 10 μm. Error bars indicate SEM.
Figure 4.
Figure 4.
Aβ peptides did not induce significant changes in the mitochondrial potential. a, JC-1 imaging of mitochondrial potentials in hippocampal neurons before and after 30 min Aβ treatment. The differential interference contrast and merged fluorescence from both the green and red fluorescence of the same neurons are shown. Mitochondria with low membrane potential were stained green, whereas mitochondria with high potential displayed red aggregates of JC-1. Scale bar, 20 μm. b, Quantitative analysis of the percentage of mitochondria (MC) with red aggregates before and after 30 min Aβ treatment. The data presented in the bar graph came from five different cultures and contained ≥20 image fields (over 30 cells). Error bars indicate SEM. HP, High potential.
Figure 5.
Figure 5.
Ca2+ responses to Aβ application. a–c, Time-lapse measurements of the changes in [Ca2+]i by fluo-4 imaging from 10 individual cells undergoing three different treatments: control saline (Ctrl; a), 20 μm25–35 (b), and 20 μm25–35 in Ca2+-free Krebs'–Ringer's solution (c). Each trace depicts the relative change of the fluo-4 intensity (ΔF/F0) in one neuron before and after bath application of control or Aβ solution (indicated by the arrows). d, Impairment of mitochondrial transport of hippocampal neurons by different concentrations of Aβ25–35 in Ca2+-containing and Ca2+-free Krebs'–Ringer's solutions. e, Effects of BAPTA loading on mitochondrial transport with and without Aβ25–35. *p < 0.01 significant difference from the corresponding control (Student's t test). MC, Mitochondria. Error bars indicate SEM.
Figure 6.
Figure 6.
Involvement of PKA and GSK3β in acute Aβ impairment of mitochondrial transport. The bar graph depicts the percentages of moving mitochondria (MC) remaining after a 30 min treatment with different compounds with and without Aβ25–35. For clarity, results from cells exposed to Aβ25–35 are depicted in gray. Plus and minus signs indicate the presence and absence of the particular compounds in bath, respectively. Aβ25–35, 20 μm; Rp-cAMP, 50 μm; KT5720, 200 nm; Db-cAMP, 500 μm; forskolin, 30 μm; pituitary adenylate cyclase activating peptide (PACAP), 10 nm; lithium chloride (LiCl), 1 mm; valproic acid (VPA), 0.6 mm; SB415286, 10 μm. Each condition was repeated at least three times from different rounds of cultures and was averaged from 20–30 cells. *p < 0.01 (Student's t test). Error bars indicate SEM.
Figure 7.
Figure 7.
Cell death in hippocampal cultures induced by long-term exposure to Aβ peptides. a, Quantitative analysis of apoptotic cells by Hoechst 33342 labeling of nuclei. A representative fluorescent image of Hoechst-labeled hippocampal neurons is shown in the inset, in which arrows indicate the condensed/fragmented nuclei (apoptotic cells). Quantified results are presented in the bar graph showing the percentage of apoptotic cells at various times after Aβ25–35 application. The white bars show the results from cells incubated with 20 μm25–35 continuously, and the gray bars are from the cells treated with 20 μm25–35 for only 30 min and then washed out. Asterisks indicate a significant difference from the control (zero time point). Cont., Continuous present. b, Results from the viability assay using the Live/Dead kit. Representative fluorescent images of hippocampal neurons exposed to the control and Aβ25–35 peptides. The live cells were labeled by calcein AM (green), and the dead cells were labeled by EthD-1 (red). Quantified percentages of live cells are shown in the bar graph. The asterisk indicates a significant difference from the corresponding control. c, Quantitative analysis of the cell viability of the same population of hippocampal neurons over times using trypan blue dye. In most of the experiments, 20 μm25–35 was applied to the cells for 30 min and washed, except the group labeled by Aβ 24 h, in which 20 μm25–35 was applied for 24 h. Asterisks indicate a statistical significance when comparing with the control (Ctrl) at the corresponding time point. A total of 175–500 cells (from 2–3 experiments) were examined for each condition. Scale bars, 20 μm. Error bars indicate SEM.

References

    1. Abramov AY, Canevari L, Duchen MR. Changes in intracellular calcium and glutathione in astrocytes as the primary mechanism of amyloid neurotoxicity. J Neurosci. 2003;23:5088–5095. - PMC - PubMed
    1. Abramov AY, Canevari L, Duchen MR. Beta-amyloid peptides induce mitochondrial dysfunction and oxidative stress in astrocytes and death of neurons through activation of NADPH oxidase. J Neurosci. 2004a;24:565–575. - PMC - PubMed
    1. Abramov AY, Canevari L, Duchen MR. Calcium signals induced by amyloid beta peptide and their consequences in neurons and astrocytes in culture. Biochim Biophys Acta. 2004b;1742:81–87. - PubMed
    1. Bacci A, Verderio C, Pravettoni E, Matteoli M. Synaptic and intrinsic mechanisms shape synchronous oscillations in hippocampal neurons in culture. Eur J Neurosci. 1999;11:389–397. - PubMed
    1. Banker GA, Cowan WM. Rat hippocampal neurons in dispersed cell culture. Brain Res. 1977;126:397–342. - PubMed

Publication types

MeSH terms

LinkOut - more resources