Comparative Study
. 2006 Oct 11;26(41):10577-89.
doi: 10.1523/JNEUROSCI.1767-06.2006.

Dopaminergic control of sleep-wake states

Affiliations
Comparative Study

Dopaminergic control of sleep-wake states

Kafui Dzirasa et al. J Neurosci. .

Abstract

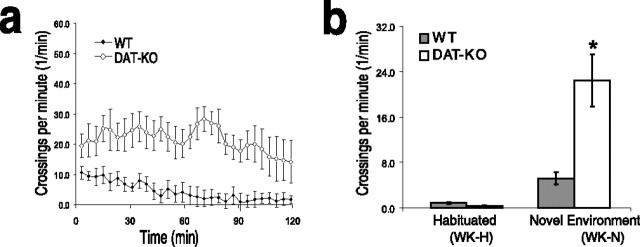
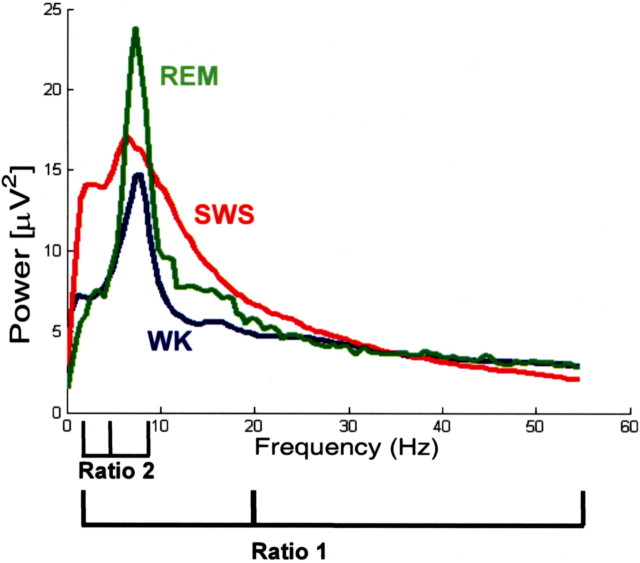
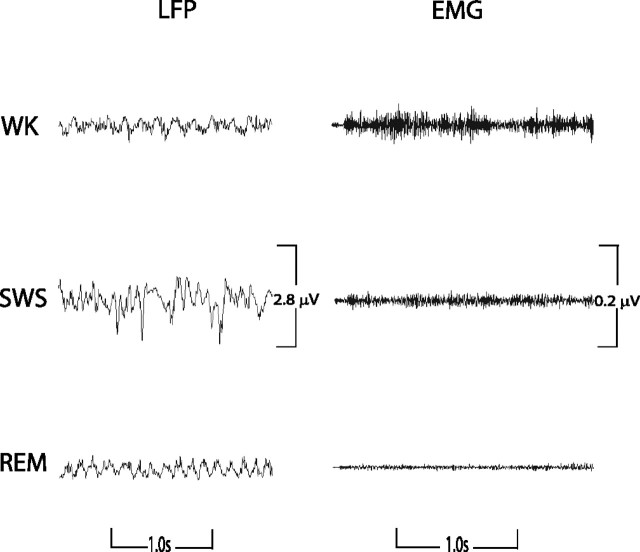
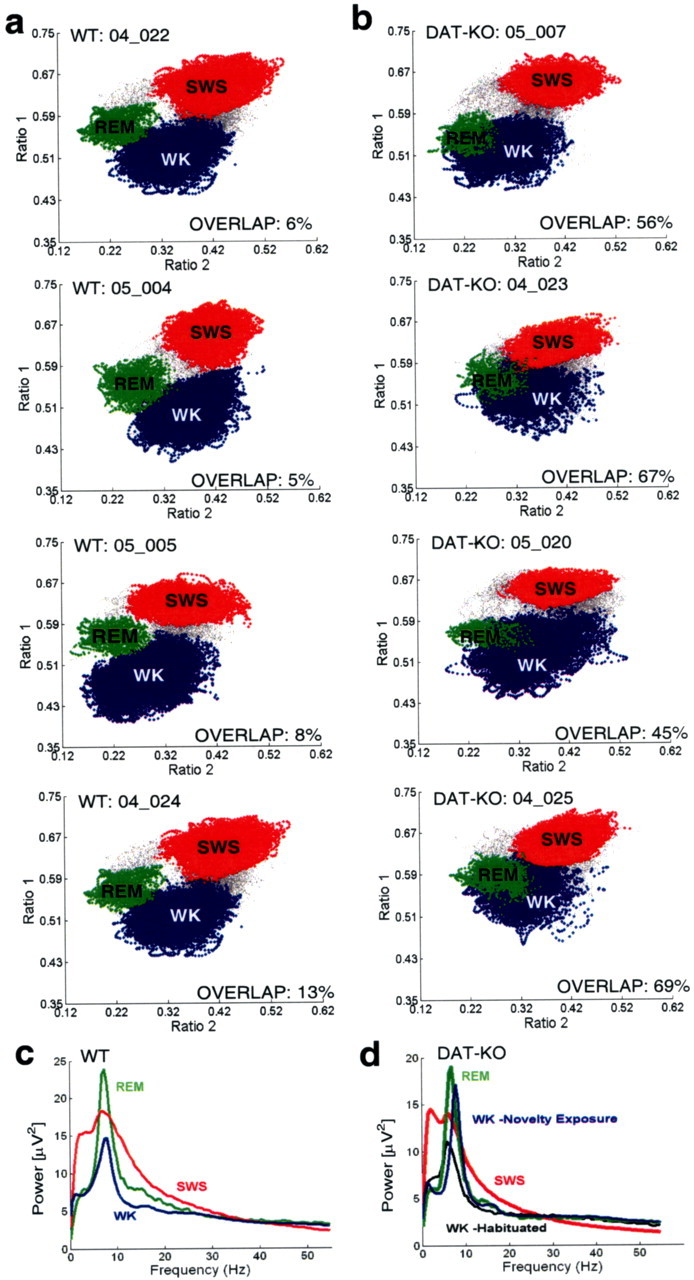
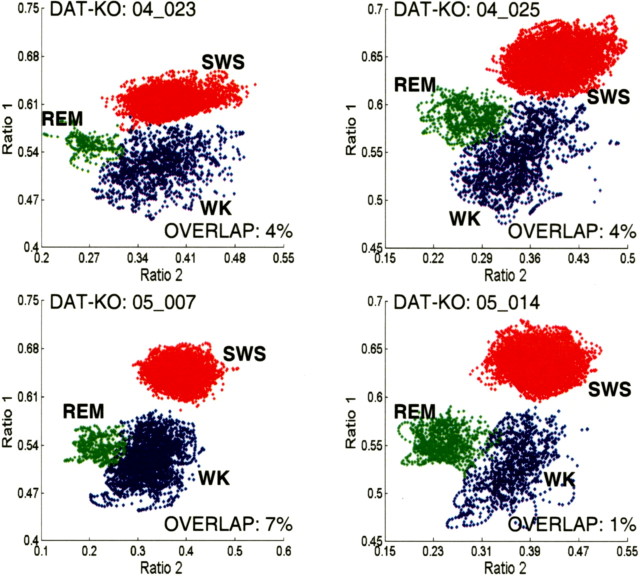
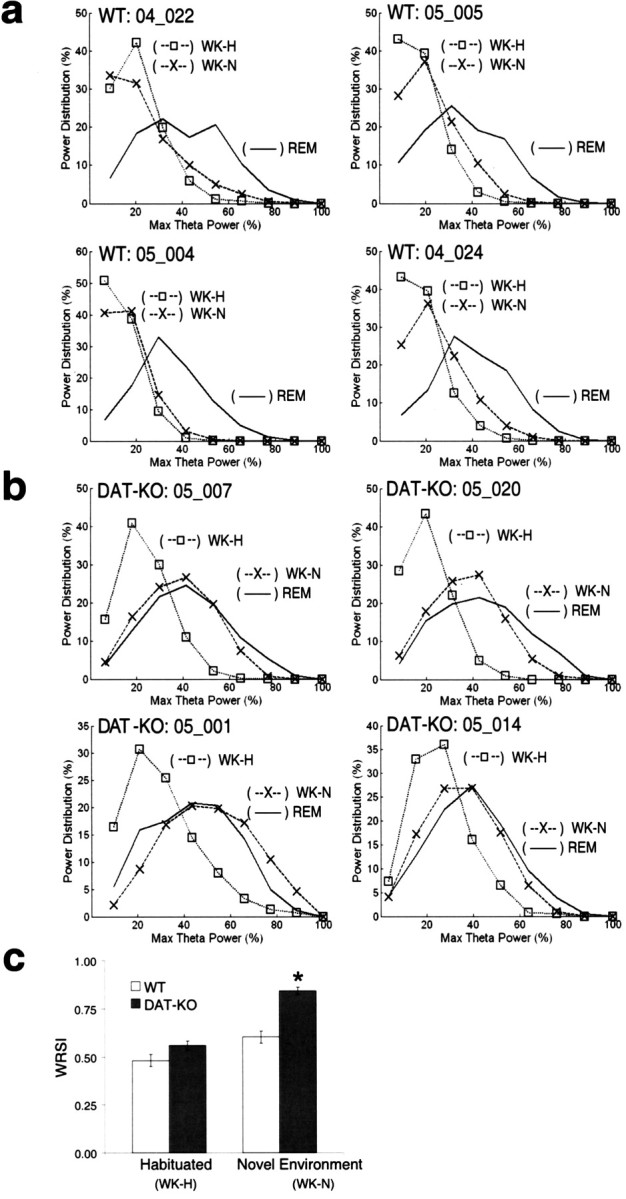
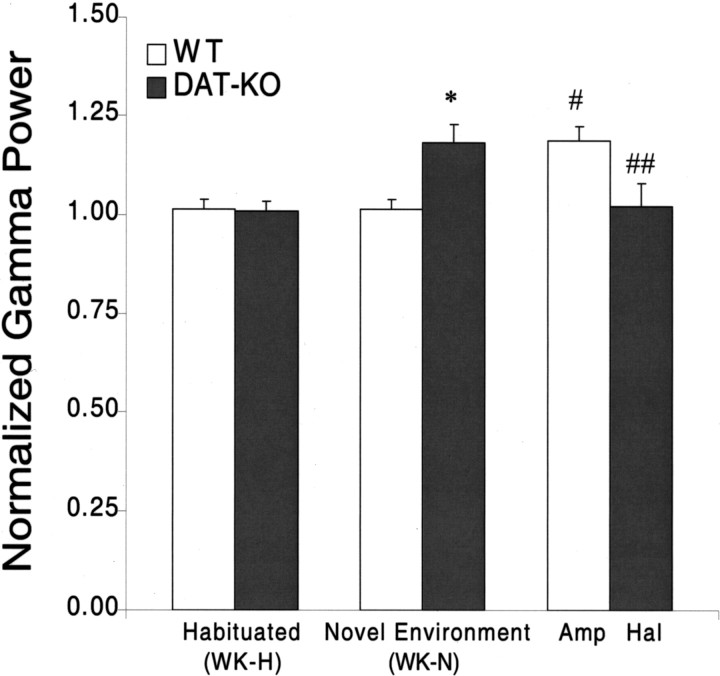
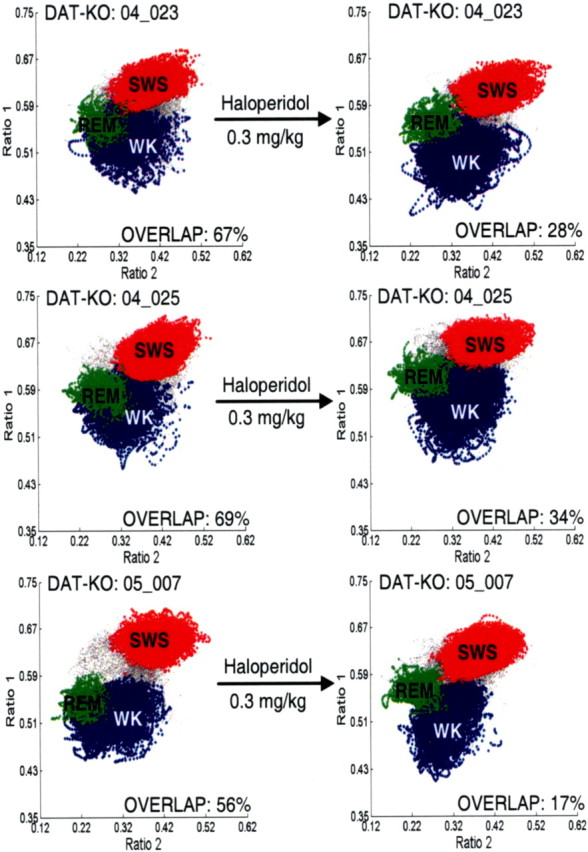
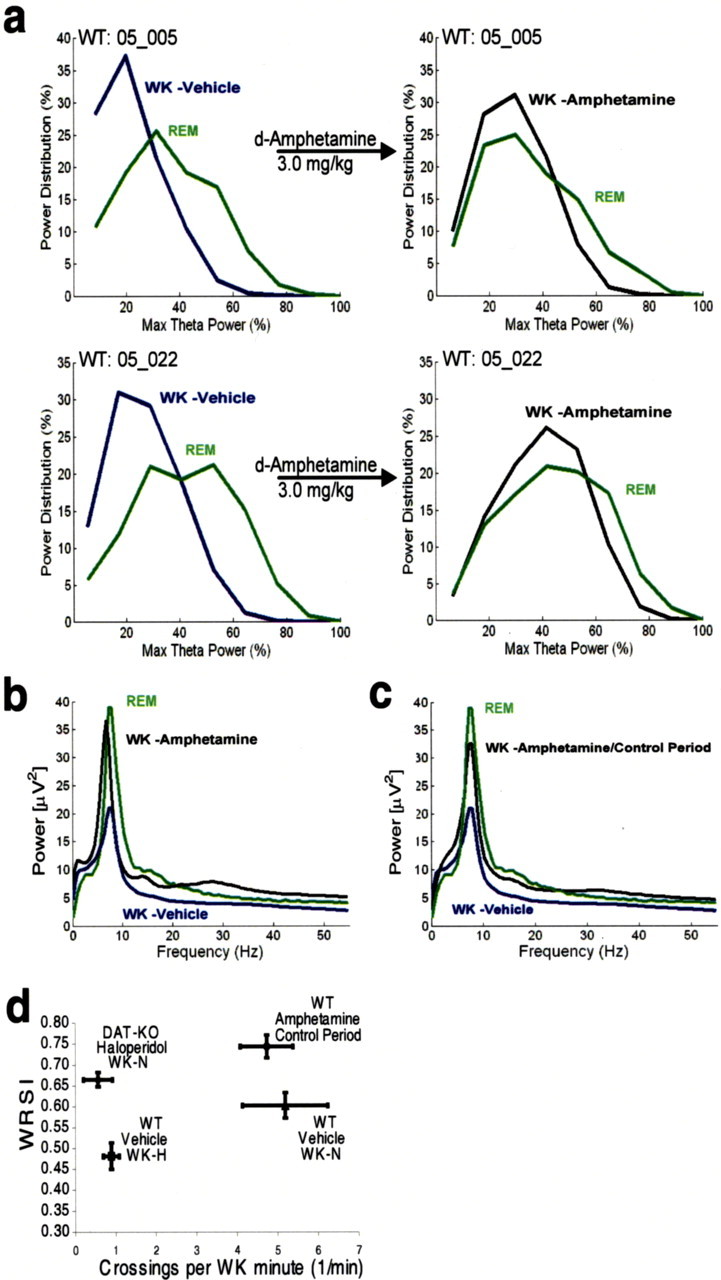
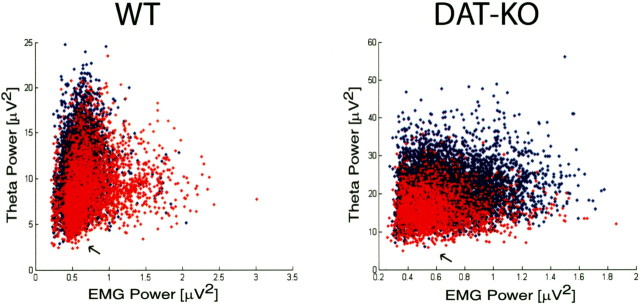
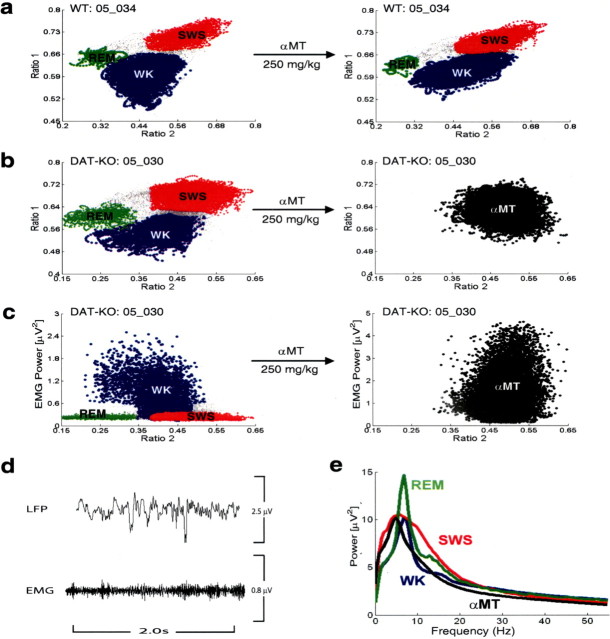
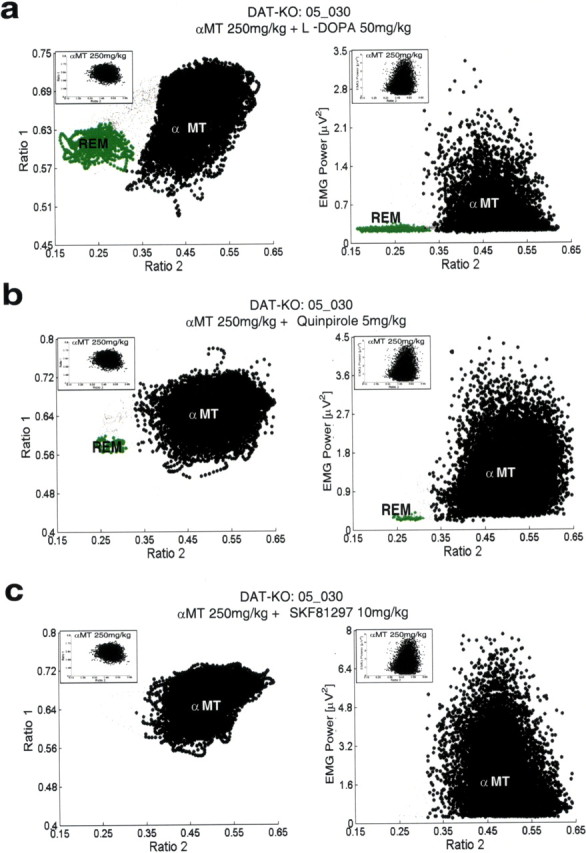
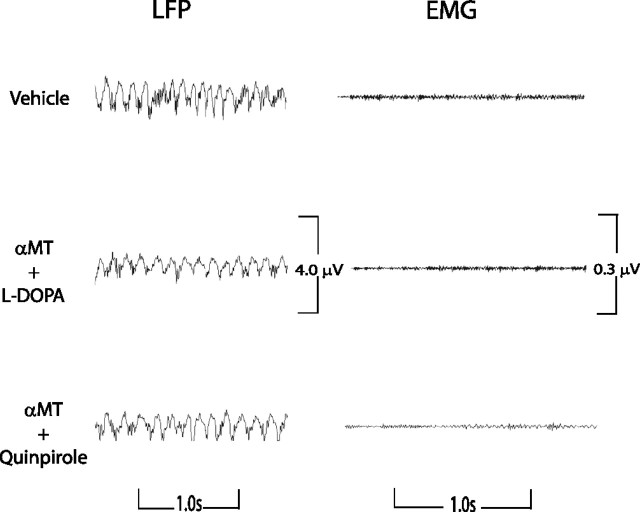
Dopamine depletion is involved in the pathophysiology of Parkinson's disease, whereas hyperdopaminergia may play a fundamental role in generating endophenotypes associated with schizophrenia. Sleep disturbances are known to occur in both schizophrenia and Parkinson's disease, suggesting that dopamine plays a role in regulating the sleep-wake cycle. Here, we show that novelty-exposed hyperdopaminergic mice enter a novel awake state characterized by spectral patterns of hippocampal local field potentials that resemble electrophysiological activity observed during rapid-eye-movement (REM) sleep. Treatment with haloperidol, a D2 dopamine receptor antagonist, reduces this abnormal intrusion of REM-like activity during wakefulness. Conversely, mice acutely depleted of dopamine enter a different novel awake state characterized by spectral patterns of hippocampal local field potentials that resemble electrophysiological activity observed during slow-wave sleep (SWS). This dopamine-depleted state is marked by an apparent suppression of SWS and a complete suppression of REM sleep. Treatment with D2 (but not D1) dopamine receptor agonists recovers REM sleep in these mice. Altogether, these results indicate that dopamine regulates the generation of sleep-wake states. We propose that psychosis and the sleep disturbances experienced by Parkinsonian patients result from dopamine-mediated disturbances of REM sleep.


Figures

Figure 1.
Figure 1.
Behavioral dynamics of DAT-KO and WT control mice. a, Locomotion of DAT-KO mice and WT control mice in a novel environment. b, DAT-KO mice display locomotor hyperactivity during the WK-N period compared with WT control mice (n = 7). There was no significant difference between DAT-KO and WT mice during the habituated period (Kruskal–Wallis test: df = 3, p < 0.0001; followed by Mann–Whitney test; *p < 0.01 for comparisons of DAT-KO and WT control mice during WK-N, p > 0.05 for comparisons during WK-H; n = 8 for DAT-KO; n = 7 for WT control mice). Error bars indicate SEM.
Figure 2.
Figure 2.
Determination of state map ratios from power spectrum analysis. Behavioral state maps were generated by plotting the following spectral ratios: x-axis, 2–4.5 Hz/2–9 Hz (Ratio 2); y-axis, 2–20 Hz/2–55 Hz (Ratio 1).
Figure 3.
Figure 3.
LFP and EMG activity during state map predicted behavioral states. Mice were introduced into a novel cage and subjected to 12 h continuous LFP (hippocampus) and EMG (trapezius) recordings. Real-time two-dimensional behavioral state maps were generated by plotting the following spectral ratios: x-axis, 0.5–4.5 Hz/0.5–9 Hz; y-axis, 0.5–20 Hz/0.5–55 Hz. Raw LFP and EMG activity was analyzed during periods of WK, SWS, and REM sleep predicted by the two-dimensional state map. As demonstrated previously, WK was characterized by high brain activity and high muscle activity, SWS was characterized by low brain activity and low muscle activity, and REM was characterized by high brain activity and negligible muscle activity (atonia).
Figure 4.
Figure 4.
DAT-KO mice display novel REM-like awake state. Mice were introduced into a novel cage and subjected to 12 h continuous LFP (hippocampus) and EMG (trapezius) recordings. Two-dimensional behavioral state maps were generated by plotting the following spectral ratios: x-axis, 2–4.5 Hz/2–9 Hz; y-axis, 2–20 Hz/2–55 Hz. EMG data were used to disambiguate WK and REM clusters. All unassigned time points, typically corresponding to interstate transitions, were coded gray. a, WT mice displayed clear separation of the WK (blue), SWS (red), and REM (green) clusters. b, DAT-KO mice displayed distinct SWS clusters (red) but showed fused WK (blue) and REM (green) clusters. c, WT mice displayed state-dependant power spectral patterns characteristic of REM (green), SWS, and WK (blue) in rodents. REM was characterized by high-amplitude theta (4–9 Hz) and gamma (33–55 Hz) oscillations, SWS was characterized by high-amplitude delta (1–4 Hz) and low-amplitude gamma oscillations, and WK was characterized by high-amplitude gamma oscillations. d, DAT-KO mice displayed state-dependant power spectral oscillations characteristic of REM and SWS. WK spectrogram patterns displayed an REM-like distribution after exposure to novelty (blue) and normalized once the animals habituated to the novel environment (black).
Figure 5.
Figure 5.
Habituated DAT-KO display normal behavioral state maps. Mice were introduced into a novel cage and subjected to 12 h continuous LFP (hippocampus) and EMG (trapezius) recordings. State maps were generated from LFPs, recorded 8–12 h after the animal was introduced into the novel cage, by plotting the following spectral ratios: x-axis, 2–4.5 Hz/2–9 Hz; y-axis, 2–20 Hz/2–55 Hz. EMG data were used to disambiguate WK and REM clusters. DAT-KO mice displayed clear separation of the WK (blue), SWS (red), and REM (green) clusters during the behaviorally habituated period.
Figure 6.
Figure 6.
Hyperdopaminergia and WK-N are necessary for generation of the REM-like awake state. a, b, Peak theta power distributions were determined for WT (a) and DAT-KO (b) mice during awake periods in a novel (WK-N) environment (×), habituated (WK-H) environment (□), and REM sleep (solid line) behavioral periods and normalized to the maximum peak power observed during REM. c, The WRSI shows that the peak theta power distribution during WK-N in DAT-KO mice (n = 8) is significantly more similar to that of REM than the WK-H/DAT-KO, WK-H/WT, and WK-N/WT (n = 8) distributions (Kruskal–Wallis test: df = 3, p < 0.0001; followed by Mann–Whitney test; *p < 0.001). There was no statistical difference between WT and DAT-KO animals during the habituated period (p > 0.1).
Figure 7.
Figure 7.
Novelty-induced hippocampal gamma oscillations in hyperdopaminergic mice. WT and DAT-KO mice were introduced into a novel cage and subjected to 12 h continuous LFP (hippocampus) and EMG (trapezius) recordings. Mean hippocampal gamma power was determined during the waking period immediately after WK-N and after habituation (WK-H). These values were then normalized to the mean gamma power observed during REM sleep for each animal. Novelty exposure significantly increased hippocampal gamma oscillations in DAT-KO mice (Kruskal–Wallis test: df = 3, p < = 0.01; followed by Mann–Whitney test; *p < 0.01) but not in WT mice (Mann–Whitney test, p > 0.05; n = 8 for DAT-KO and WT control mice). There was no statistical difference in hippocampal gamma power observed in DAT-KO and WT mice after habituation (Mann–Whitney test, p > 0.05). Treatment with 3.0 mg/kg amphetamine (Amp) significantly increased hippocampal gamma oscillations in WT control mice (Mann–Whitney test; # p < 0.05 compared with WT control mice/WK-N). Treatment with 0.3 mg/kg haloperidol (Hal) significantly reduced gamma oscillations in novelty-exposed DAT-KO mice (Mann–Whitney test; ## p < 0.05 compared with DAT-KO mice/WK-N).
Figure 8.
Figure 8.
D2 antagonist attenuates REM-like awake state in novelty-exposed DAT-KO mice. After initial recordings (left column), DAT-KO animals were given intraperitoneal injections of a single dose of 0.3 mg/kg haloperidol (right column), placed in a novel environment, and subjected to additional 12 h recordings. The haloperidol-treated group displayed significantly less overlap of WK (blue) and REM (green) clusters compared with the untreated group (p < 0.05, Mann–Whitney test). All unassigned time points, typically corresponding to interstate transitions, are coded gray.
Figure 9.
Figure 9.
The role of hyperdopaminergia and locomotor hyperactivity in generating WK/REM similarity. After initial recordings (left column), WT animals were given intraperitoneal injections of a single dose of 3.0 mg/kg amphetamine (right column), placed in a novel environment, and subjected to 12 h recordings. a, b, WT mice treated with amphetamine displayed WK-N peak theta power distributions (a) and LFP power spectrum oscillations (b) that were similar to those observed during REM. c, Hippocampal LFP oscillations displayed REM-like distribution in amphetamine-treated WT mice even after the cessation of behavioral hyperactivity. d, WT mice treated with amphetamine (n = 5) displayed significantly elevated WRSI values after cessation of behavioral hyperactivity compared with untreated WT control mice (n = 5) during WK-N. DAT-KO mice treated with 0.3 mg/kg haloperidol (n = 4) displayed significantly elevated WRSI values during WK-N compared with WT control mice during WK-H (p < 0.05, Mann–Whitney test).
Figure 10.
Figure 10.
Activity independent theta oscillations during WK-N in DAT-KO mice. WT and DAT-KO mice were introduced into a novel cage and subjected to 12 h continuous LFP (hippocampus) and EMG (trapezius) recordings. Peak theta power and EMG activity was determined for each second period. WT mice displayed similar levels of theta power immediately after exposure to novelty (blue) and after habituation (red) at low levels of EMG activity (arrows). DAT-KO mice displayed higher theta power after exposure to novelty (blue) than after habituation (red) at low levels of EMG activity as seen by the increase in visible blue area.
Figure 11.
Figure 11.
Dopamine depletion suppresses REM sleep and generates novel awake state in DAT-KO mice. a, After baseline behavioral state recordings (left), WT mice were treated with a single dose of 250 mg/kg αMT intraperitoneally, placed in a novel environment, and subjected to 6 h LFP (hippocampus) and EMG (trapezius) recordings. Two-dimensional behavioral state maps were generated by plotting the following spectral ratios: x-axis, 0.5–4.5 Hz/0.5–9 Hz; y-axis, 0.5–20 Hz/0.5–55 Hz. EMG data were used to disambiguate WK and REM clusters. All unassigned time points, typically corresponding to interstate transitions, are coded gray. WT mice treated with αMT (right) continued to display REM sleep clusters during the 6 h recording period, although total REM time was dramatically reduced. b, c, After baseline behavioral state recordings in their home cage (left), DAT-KO mice were treated with a single dose of 250 mg/kg αMT intraperitoneally, placed in a novel environment, and subjected to 8 h LFP (hippocampus) and EMG (trapezius) recordings. b, DAT-KO mice treated with αMT displayed LFP spectral ratios that were indistinguishable from those observed during SWS sleep in untreated animals. Because our state map method did not produce cluster separation between WK and SWS in DDD mice, we termed this state “αMT.” This phenomenon lasted the entire 8 h period, and no REM clusters were observed. c, Dopamine-depleted DAT-KO mice also displayed significant increases in EMG activity during this period, corresponding to increased muscle rigidity. d, DAT-KO mice treated with αMT displayed high-amplitude, low-frequency LFP oscillations by during awake periods marked by high muscle tone. e, State-dependent hippocampal LFP power spectral data observed in DAT-KO mice before and after being treated with αMT. The αMT (black) state was characterized by a reduction in mean hippocampal theta spectral power compared with WK (blue) and REM (green) in untreated animals and a reduction in mean hippocampal gamma spectral power compared with WK, SWS (red), and REM.
Figure 12.
Figure 12.
Selective recovery of REM sleep in DDD mice. DDD mice were treated intraperitoneally with a single dose of 50 mg/kg l-DOPA, 5 mg/kg Quinpirole, or 10 mg/kg SKF 81297, placed in a novel environment, and subjected to 6 h LFP (hippocampus) and EMG (trapezius) recordings. Two-dimensional behavioral state maps were generated by plotting the following spectral ratios: x-axis, 0.5–4.5 Hz/0.5–9 Hz; y-axis, 0.5–20 Hz/0.5–55 Hz. EMG data were used to disambiguate WK and REM clusters. All unassigned time points, typically corresponding to interstate transitions, are coded gray. a, Treatment with 50 mg/kg l-DOPA recovered a clear state map REM sleep cluster (left) that was marked by low EMG activity (right), although it did not completely reverse the αMT state observed in DDD mice. State maps and EMG plots observed in untreated DDD mice are displayed at the top left of each plot. b, DDD mice treated with the D2 dopamine receptor agonist Quinpirole (5 mg/kg) displayed a clear REM sleep cluster (left) that was marked by low EMG activity (right). Treatment with Quinpirole did not reverse the αMT observed in DDD mice. c, DDD mice treated with the D1 dopamine receptor agonist SKF 81297 (10 mg/kg) displayed neither recovery of an REM sleep cluster nor reversal of the αMT state.
Figure 13.
Figure 13.
Raw LFP and EMG activity during selective recovery of REM sleep in DDD mice. DDD mice were treated intraperitoneally with a single dose of 50 mg/kg l-DOPA or 5 mg/kg Quinpirole, placed in a novel environment, and subjected to 6 h LFP (hippocampus) and EMG (trapezius) recordings. DDD mice displayed trains of theta oscillations and atonia during periods of REM sleep recovered by treatment with l-DOPA or Quinpirole, similar to that observed during REM sleep in untreated DAT-KO mice.

Similar articles

Cited by

References

    1. Abbott A. Neuroscience: while you were sleeping. Nature. 2005;437:1220–1222. - PubMed
    1. Adler CH. Nonmotor complications in Parkinson's disease. Mov Disord. 2005;20:S23–S29. - PubMed
    1. Aserinsky E, Kleitman N. Regularly occurring periods of eye motility, and concomitant phenomena, during sleep. Science. 1953;118:273–274. - PubMed
    1. Aston-Jones G, Bloom FE. Activity of norepinephrine-containing locus coeruleus neurons in behaving rats anticipates fluctuations in the sleep-waking cycle. J Neurosci. 1981;1:876–886. - PMC - PubMed
    1. Bjorklund A, Lindvall O. Dopamine-containing systems in the CNS. In: Hokfelt T, editor. Handbook of chemical neuroanatomy. Amsterdam: Elsevier; 1984. pp. 52–122.

Publication types

MeSH terms

Substances

LinkOut - more resources