. 2006 Nov;24(5):1011-7.
doi: 10.1002/jmri.20751.

In vivo measurement of plaque burden in a mouse model of Alzheimer's disease

Affiliations

In vivo measurement of plaque burden in a mouse model of Alzheimer's disease

Arijitt Borthakur et al. J Magn Reson Imaging. 2006 Nov.

Abstract

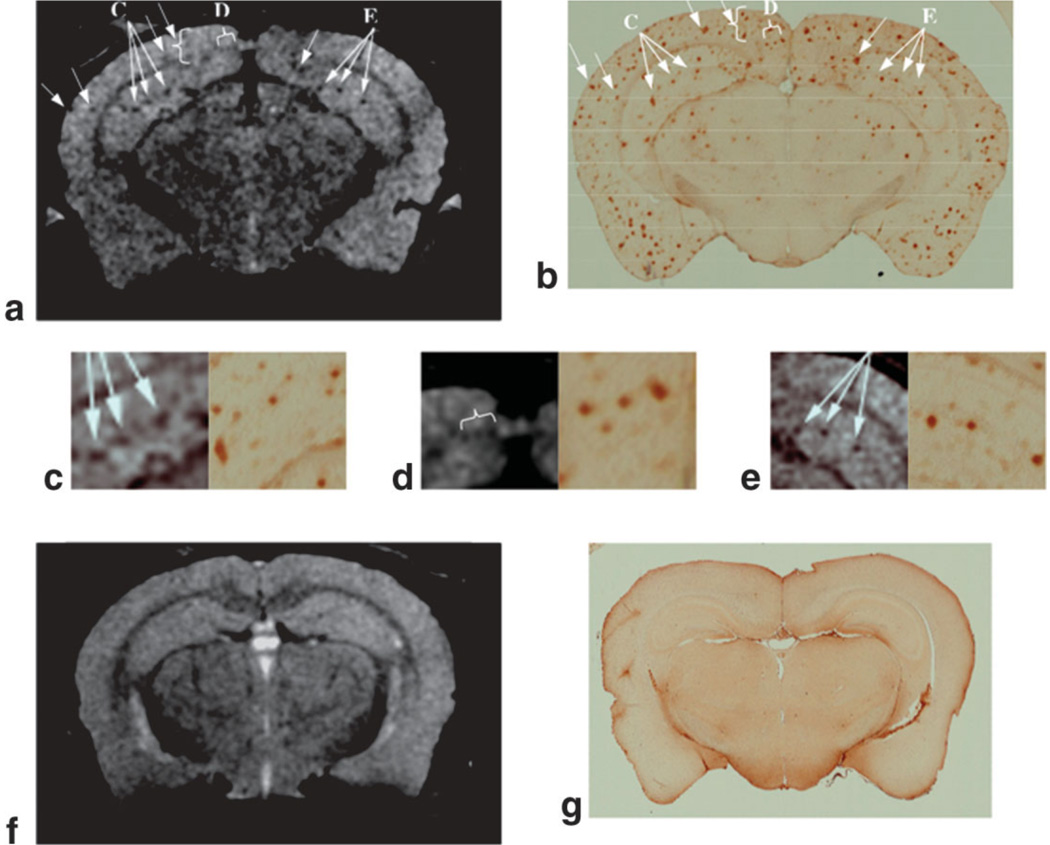
Purpose: To demonstrate an MRI method for directly visualizing amyloid-beta (Abeta) plaques in the APP/PS1 transgenic (tg) mouse brain in vivo, and show that T1rho relaxation rate increases progressively with Alzheimer's disease (AD)-related pathology in the tg mouse brain.

Materials and methods: We obtained in vivo MR images of a mouse model of AD (APP/PS1) that overexpresses human amyloid precursor protein, and measured T1rho via quantitative relaxometric maps.

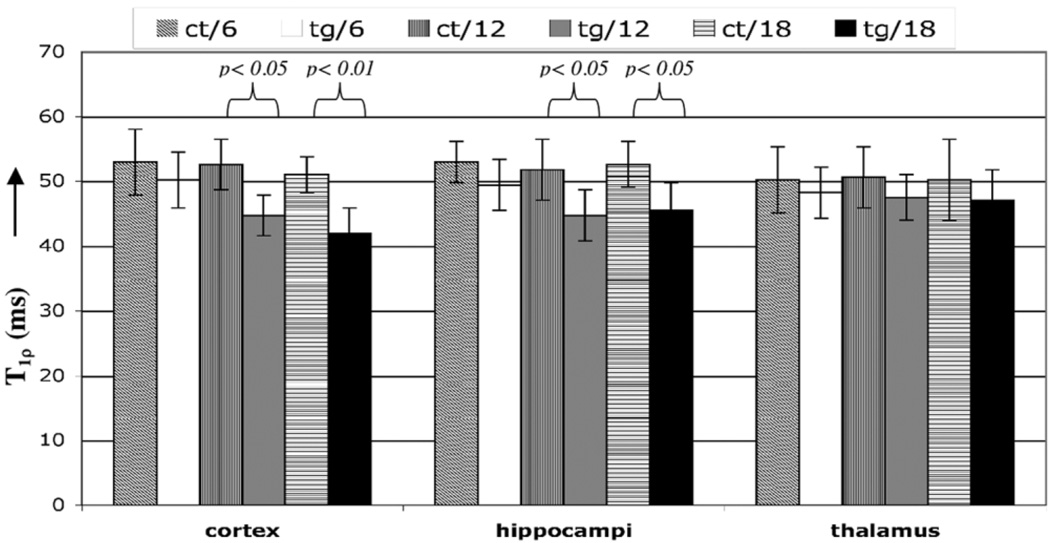
Results: A significant decrease in T1rho was observed in the cortex and hippocampus of 12- and 18-month-old animals compared to their age-matched controls. There was also a correlation between changes in T1rho and the age of the animals.

Conclusion: T1rho relaxometry may be a sensitive method for noninvasively determining AD-related pathology in APP/PS1 mice.


Figures

Figure 1
Figure 1
Location of the ROIs used for all data analyses overlaid on a T-weighted image. Actual data were collected in the calculated T map, an example of which is shown in color in Fig. 3. The trapezoid represents the boundary of the measurements performed in the cortex, the solid squares are located in the hippocampi, and the dashed square is in the thalamus. The total number of distinct pixels and therefore T values in each location was 100.
Figure 2
Figure 2
a: A T-weighted MR image of the APP/PS1 mouse brain shows hypointense regions, some of which are indicated by arrows. b: The corresponding histologic image created by combining five 10-µm-thick immunostained sections shows abundant Aβ deposits. c–e: The higher magnification views correspond to regions indicated by the arrows in part a to show identical clusters of Aβ deposits in the hippocampus and cortex in both MR images and histological sections. The T-weighted MR image of an age-matched control (f) and corresponding histology (g) failed to show SPs.
Figure 3
Figure 3
Example of T images from a single data set obtained at different durations of the spin-lock pulse (TSL) that was used to calculate the T map (rightmost image, shown in color). In such maps, each pixel’s intensity is the actual T relaxation time constant of that pixel. Values above 100 msec, such as in fluid in the ventricles, are set to yellow, and pixels that did not correlate with TSL in the fitting routine, such as in the skull and background, were set to 0 (transparent).
Figure 4
Figure 4
T color map overlaid on a grayscale T-weighted image (a) and corresponding Thioflavin-S stained histology section (b) of an 18-month-old tg mouse, and a T map of an age-matched control (c). During the MRI, identical slices were selected in both animals for meaningful comparisons. Although the histologic section is 40 µm thick and the MRI slice thickness is 250 µm, some of the pixels with low T values are in the same location as large Aβ deposits in the histology (indicated in a and b). The color bar-scale on the left indicates the range of T values.
Figure 5
Figure 5
T values averaged from ROIs in both animals, in the locations indicated. The maximum difference was observed between the 18-month-old tg animals and controls (9 msec), and was statistically significant (P < 0.01). The difference between the 12-month-old tg mice and controls was significant in both the cortex and hippocampus. The thalamus had reduced T values (~2 msec) in all age groups, but the difference was not significant.

References

    1. Dawbarn D, Allen SJ. Neurobiology of Alzheimer’s disease. New York: Oxford University Press; 2001. p. 409. xvi.
    1. Prince M. The need for research on dementia in developing countries. Trop Med Int Health. 1997;2:993–1000. - PubMed
    1. Selkoe DJ. Translating cell biology into therapeutic advances in Alzheimer’s disease. Nature. 1999;399 Suppl 6738:A23–A31. - PubMed
    1. Lee VM, Goedert M, Trojanowski JQ. Neurodegenerative tauopathies. Annu Rev Neurosci. 2001;24:1121–1159. - PubMed
    1. Benveniste H, Einstein G, Kim KR, Hulette C, Johnson GA. Detection of neuritic plaques in Alzheimer’s disease by magnetic resonance microscopy. Proc Natl Acad Sci USA. 1999;96:14079–14084. - PMC - PubMed

Publication types