. 2006 Dec 15;577(Pt 3):957-70.
doi: 10.1113/jphysiol.2006.121970. Epub 2006 Oct 12.

Postnatal changes in ventilation during normoxia and acute hypoxia in the rat: implication for a sensitive period

Affiliations

Postnatal changes in ventilation during normoxia and acute hypoxia in the rat: implication for a sensitive period

Qiuli Liu et al. J Physiol. .

Abstract

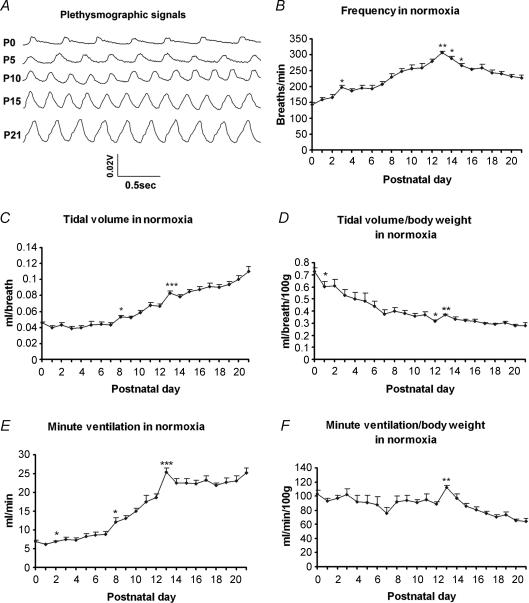
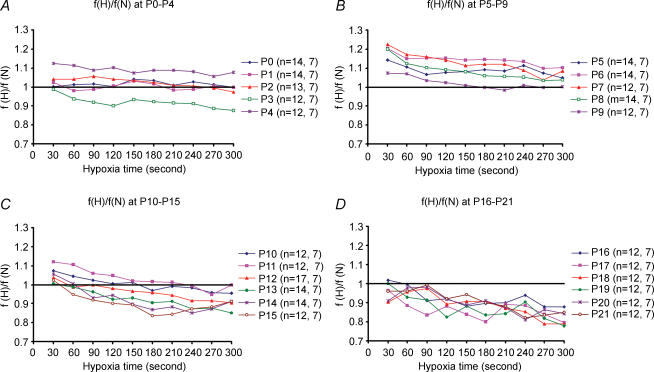
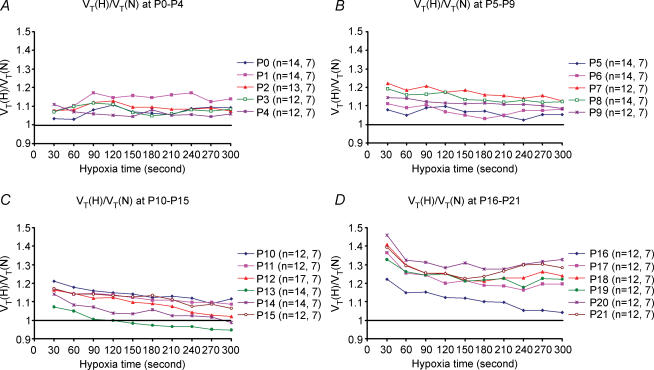
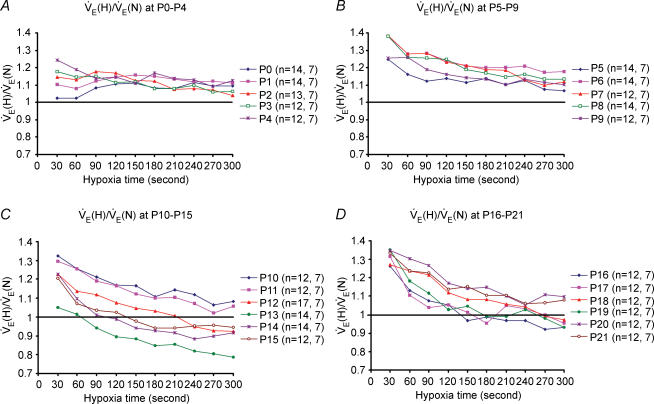
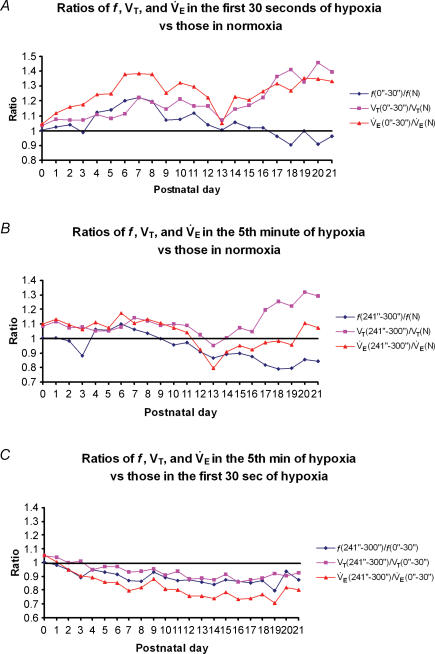
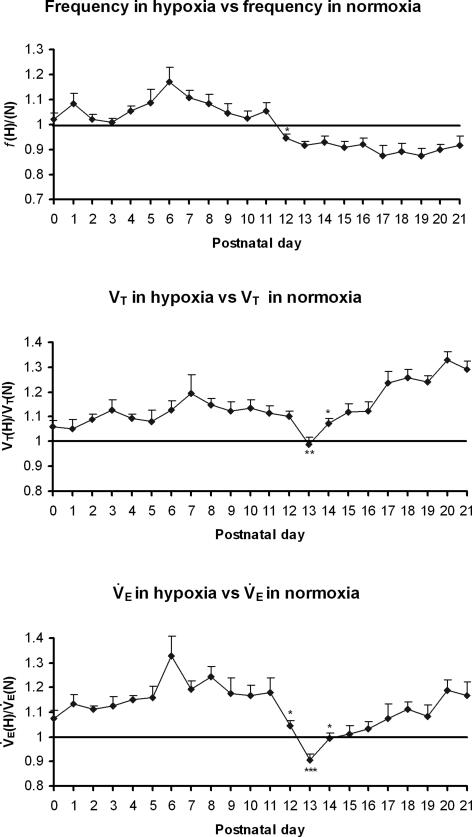
Previously, we found heightened expression of inhibitory neurochemicals and depressed expression of excitatory neurochemicals with a sudden drop in metabolic activity around postnatal day (P) 12 in rat brainstem respiratory nuclei, suggesting that this period is a critical window during which respiratory control or regulation may be distinctly different. To test this hypothesis, the hypoxic ventilatory responses (HVR) to 10% oxygen were tested in rats every day from P0 to P21. Our data indicate that (1) during normoxia (N), breathing frequency (f) increased with age, peaking at P13, followed by a gradual decline, whereas both tidal volume (V(T)) and minute ventilation (.V(E) ) significantly increased in the second postnatal week, followed by a progressive increase in V(T) and a relative plateau in .V(E); (2) during 5 min of hypoxia (H), .V(E) exhibited a biphasic response from P3 onward. Significantly, the ratio of .V(E)(H) to .V(E)(N) was generally > 1 during development, except for P13-16, when it was < 1 after the first 1-2 min, with the lowest value at P13; (3) the H : N ratio for f, V(T) and .V(E) during the first 30 s and the last minute of hypoxia all showed a distinct dip at P13, after which the V(T) and .V(E) values rose again, while the f values declined through P21; and (4) the H : N ratios for f, V(T) and .V(E) averaged over 5 min of hypoxia all exhibited a sudden fall at P13. The f ratio remained low thereafter, while those for V(T) and .V(E) increased again with age until P21. Thus, hypoxic ventilatory response is influenced by both f and V(T) before P13, but predominantly by V(T) after P13. The striking changes in normoxic ventilation as well as HVR at or around P13, together with our previous neurochemical and metabolic data, strongly suggests that the end of the second postnatal week is a critical period of development for brainstem respiratory nuclei in the rat.


Figures

Figure 1
Figure 1. Postnatal development of ventilatory response during normoxia
Representative raw plethysmographic signals at P0, P5, P10, P15 and P21 are shown (A). The developmental trends of frequency (f) (B), tidal volume (VT) (C), and minute ventilation (V˙E) (E) during normoxia all increased significantly during the 2nd postnatal week, peaking at P13 (P < 0.001), after which F values fell steadily until P21 (the last postnatal day tested), while VT and V˙E values initially fell at P14 but rose again until P21. When VT was normalized to body weight (D), its trend decreased with age, with a significant fall from P0 to P1, and from P11 to P12 (P < 0.05 for both), and a significant increase at P13 (P < 0.01) followed by a relative plateau until a small rise at P21. The developmental trend of V˙E normalized to body weight (F) showed minor fluctuations from P0 to P12. There was a significant rise in V˙E at P13 (P < 0.01), followed by a gradual decrease thereafter. ANOVA within each parameter showed significant differences among ages (P < 0.01). Statistical comparisons (Tukey's Studentized range test) between successive age groups: *P < 0.05, **P < 0.01, ***P < 0.001 (significance between one age group and its adjacent younger age group).
Figure 2
Figure 2. Frequency (f) changes with age during a 5 min exposure to hypoxia
Changes in f values every 30 s during a 5 min exposure to hypoxia (H) (inspired O2 fraction: 0.1) as compared to normoxia (i.e. f(H) : f(N) ratio; with f(N) values = 1) are depicted for ages P0–4 (A), P5–9 (B), P10–15 (C) and P16–21 (D). The number of animals (n), followed by the number of litters at each day tested are indicated in brackets. Note that the values were typically higher during the first 30 s to 1 min (except for P0) than the rest of the hypoxic period and that between P0 and P11, the ratios were generally higher than 1 (except for P3). Starting at P12, the ratios after the first 0.5–1 min fell significantly below 1 and remained low through P21.
Figure 3
Figure 3. Tidal volume (VT) changes with age during a 5 min exposure to hypoxia
Changes in VT values every 30 s during a 5 min exposure to hypoxia (H) (10% O2) as compared to normoxia (i.e. VT(H) : VT(N) ratio; with VT(N) values being 1) are depicted for ages P0–4 (A), P5–9 (B), P10–15 (C) and P16–21 (D). The number of animals (n), followed by the number of litters at each day tested are indicated in brackets. Note that starting at P4, the values were generally higher for the first 30 s and lower for the rest of the hypoxic period. Significantly, the only age when the ratio fell below 1 was at P13 (C).
Figure 4
Figure 4. Changes in minute ventilation (V˙E) with age during a 5 min exposure to hypoxia
Changes in V˙E values every 30 s during a 5 min exposure to hypoxia (H) (10% O2) as compared to normoxia (i.e. V˙E(H): V˙E(N) ratio; with V˙E(N) values being 1) are depicted for ages P0–4 (A), P5–9 (B), P10–15 (C) and P16–21 (D). The number of animals (n), followed by the number of litters at each day tested are indicated in brackets. Note that from P3 onwards the values were higher during the first 30 s than the rest of the hypoxic period, indicating a biphasic response. The late phase is essentially a plateau with minor fluctuations from P0 to P9, but from P10 to P21, the late phase shows a gradual decline with time during the 5 min period. Notably, the ratios were above 1 for most of the ages except for P13–P16, when they fell below 1 after the first 1–2 min of hypoxic exposure. The value was the lowest at P13, but steadily increased thereafter from P14 to P21.
Figure 5
Figure 5. Changes in the early and late ventilatory hypoxic responses (HVR) with age
Changes in the ratio of frequency (f), tidal volume (VT), and minute ventilation (V˙E) in the first 30 s (A) or the last minute (B) of response to 5 min of hypoxia versus those in normoxia showed similar bell-shaped trends from P0 to P12 (except for a significant fall of the f ratio at P3, P < 0.05), with the peak at around P6–P7. At P12, the trends shifted downward, followed by a significant drop at P13. From P14 onwards, values for VT and V˙E increased with age, while that of f decreased with age for both the first 30 s and the last minute of HVR. C, the ratios of f, VT and V˙E in the fifth minute versus those in the first 30 s of HVR all decreased gradually with age, with only minor fluctuations in between. The values for all three parameters during the fifth minute are significantly lower than those in the first 30 s from P6 to P21 (P < 0.05–0.001).
Figure 6
Figure 6. Developmental changes in the mean values of frequency, tidal volume and minute ventilation during the entire 5 min exposure to hypoxia
Changes in the mean values of frequency (f) (A), tidal volume (VT) (B), and minute ventilation (V˙E) (C) averaged over 5 min of hypoxic ventilatory response versus those in normoxia indicate that their values were all above 1 from P0 to P12, with a peak at P6 (for f and V˙E) or P7 (for VT). At P12, the f and V˙E ratios dropped precipitously (P < 0.05 for both), and at P13, the ratios for VT and VE were significantly lower than those at P12 (P < 0.01−0.001) with the VT and V˙E ratios reaching their lowest on that day, and V˙E ratio significantly below 1. After P13, VT and V˙E ratios both increased with age (especially at P14, P < 0.05) while f ratios remained below 1 through P21. ANOVA of each parameter indicated significant differences among ages (P < 0.01). Statistical comparisons (Tukey's Studentized range test) between successive age groups: *P < 0.05; **P < 0.01; ***P < 0.001.
Figure 7
Figure 7. Changes in body temperature (Tb) and body weight with age
A, under normoxic conditions, Tb was lowest at P0–P2, increased significantly between P3 and P4, then gradually increased until another peak at P13, followed by a small decline at P14 and a gradual increase with age until P21. After 5 min of exposure to hypoxia, Tb fell 1–2°C from P0–15, but was close to the baseline (Tb in normoxia) thereafter, and the two trends intersected at P21. Statistical comparisons (Student's t test) between Tb in normoxia and hypoxia: *P < 0.05; **P < 0.01; ***P < 0.001. B, the body weight of animals increased steadily with age.

Similar articles

Cited by

References

    1. Bavis RW, Olson EB, Jr, Vidruk EH, Fuller DD, Mitchell GS. Developmental plasticity of the hypoxic ventilatory response in rats induced by neonatal hypoxia. J Physiol. 2004;557:645–660. - PMC - PubMed
    1. Ben-Ari Y, Cherubini E, Corradetti R, Gaiarsa JL. Giant synaptic potentials in immature rat CA3 hippocampal neurons. J Physiol. 1989;416:303–325. - PMC - PubMed
    1. Berquin P, Cayetanot F, Gros F, Larnicol N. Postnatal changes in Fos-like immunoreactivity evoked by hypoxia in the rat brainstem and hypothalamus. Brain Res. 2000;877:149–159. - PubMed
    1. Bissonnette JM. Mechanisms regulating hypoxic respiratory depression during fetal and postnatal life. Am J Physiol Regul Integr Comp Physiol. 2000;278:R1391–R1400. - PubMed
    1. Blanco LN. Mechanisms for the generation of gas-exchange surface area in rat lung. Am J Physiol Lung Cell Mol Physiol. 1995;269:L698–L708. - PubMed

Publication types