

Characterization of the nanoscale properties of individual amyloid fibrils
- PMID: 17038504
- PMCID: PMC1635084
- DOI: 10.1073/pnas.0604035103
Characterization of the nanoscale properties of individual amyloid fibrils
Abstract
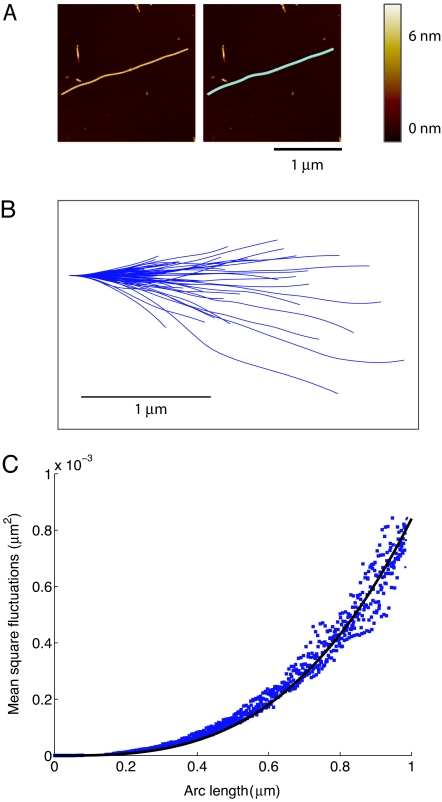
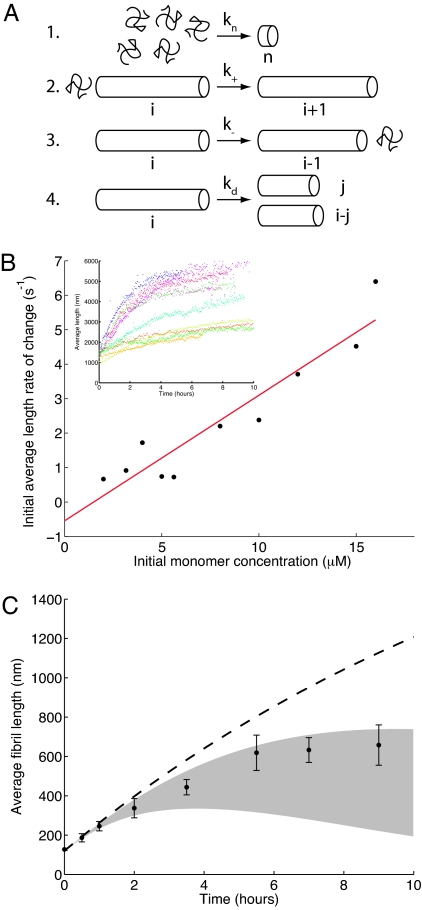
We report the detailed mechanical characterization of individual amyloid fibrils by atomic force microscopy and spectroscopy. These self-assembling materials, formed here from the protein insulin, were shown to have a strength of 0.6 +/- 0.4 GPa, comparable to that of steel (0.6-1.8 GPa), and a mechanical stiffness, as measured by Young's modulus, of 3.3 +/- 0.4 GPa, comparable to that of silk (1-10 GPa). The values of these parameters reveal that the fibrils possess properties that make these structures highly attractive for future technological applications. In addition, analysis of the solution-state growth kinetics indicated a breakage rate constant of 1.7 +/- 1.3 x 10(-8) s(-1), which reveals that a fibril 10 mum in length breaks spontaneously on average every 47 min, suggesting that internal fracturing is likely to be of fundamental importance in the proliferation of amyloid fibrils and therefore for understanding the progression of their associated pathogenic disorders.
Conflict of interest statement
The authors declare no conflict of interest.
Figures


Similar articles
-
Amyloid-like fibrils formed from intrinsically disordered caseins: physicochemical and nanomechanical properties.Soft Matter. 2015 Aug 7;11(29):5898-904. doi: 10.1039/c5sm01037c. Soft Matter. 2015. PMID: 26112282
-
Packing density and structural heterogeneity of insulin amyloid fibrils measured by AFM nanoindentation.Biomacromolecules. 2006 May;7(5):1630-6. doi: 10.1021/bm0600724. Biomacromolecules. 2006. PMID: 16677048
-
Mechanical properties of amyloid-like fibrils defined by secondary structures.Nanoscale. 2015 May 7;7(17):7745-52. doi: 10.1039/c4nr05109b. Nanoscale. 2015. PMID: 25839069
-
Exploring the structure and formation mechanism of amyloid fibrils by Raman spectroscopy: a review.Analyst. 2015 Aug 7;140(15):4967-80. doi: 10.1039/c5an00342c. Analyst. 2015. PMID: 26042229 Review.
-
Nanomechanics of functional and pathological amyloid materials.Nat Nanotechnol. 2011 Jul 31;6(8):469-79. doi: 10.1038/nnano.2011.102. Nat Nanotechnol. 2011. PMID: 21804553 Review.
Cited by
-
Structural and Mechanical Properties of Amyloid Beta Fibrils: A Combined Experimental and Theoretical Approach.J Phys Chem Lett. 2016 Jul 21;7(14):2758-64. doi: 10.1021/acs.jpclett.6b01066. Epub 2016 Jul 8. J Phys Chem Lett. 2016. PMID: 27387853 Free PMC article.
-
Physical properties of polymorphic yeast prion amyloid fibers.Biophys J. 2011 Jul 20;101(2):439-48. doi: 10.1016/j.bpj.2011.06.016. Biophys J. 2011. PMID: 21767497 Free PMC article.
-
Amyloid assembly and disassembly.J Cell Sci. 2018 Apr 13;131(8):jcs189928. doi: 10.1242/jcs.189928. J Cell Sci. 2018. PMID: 29654159 Free PMC article. Review.
-
Observation of spatial propagation of amyloid assembly from single nuclei.Proc Natl Acad Sci U S A. 2011 Sep 6;108(36):14746-51. doi: 10.1073/pnas.1105555108. Epub 2011 Aug 26. Proc Natl Acad Sci U S A. 2011. PMID: 21876182 Free PMC article.
-
In vitro high-resolution structural dynamics of single germinating bacterial spores.Proc Natl Acad Sci U S A. 2007 Jun 5;104(23):9644-9. doi: 10.1073/pnas.0610626104. Epub 2007 May 29. Proc Natl Acad Sci U S A. 2007. PMID: 17535925 Free PMC article.
References
-
- Dobson CM. Nature. 2003;426:884–890. - PubMed
-
- Fandrich M, Fletcher MA, Dobson CM. Nature. 2001;410:165–166. - PubMed
-
- Sunde M, Serpell L, Bartlam M, Fraser PE, Pepys MB, Blake C. J Mol Biol. 1997;273:729–739. - PubMed
-
- Serpell LC, Sunde M, Benson MD, Tennent GA, Pepys MB, Fraser PE. J Mol Biol. 2000;300:1033–1039. - PubMed
Publication types
MeSH terms
Substances
Grants and funding
LinkOut - more resources
Full Text Sources
Other Literature Sources
