. 2006 Oct 13;314(5797):298-300.
doi: 10.1126/science.1131000.

Tissue geometry determines sites of mammary branching morphogenesis in organotypic cultures

Affiliations

Tissue geometry determines sites of mammary branching morphogenesis in organotypic cultures

Celeste M Nelson et al. Science. .

Abstract

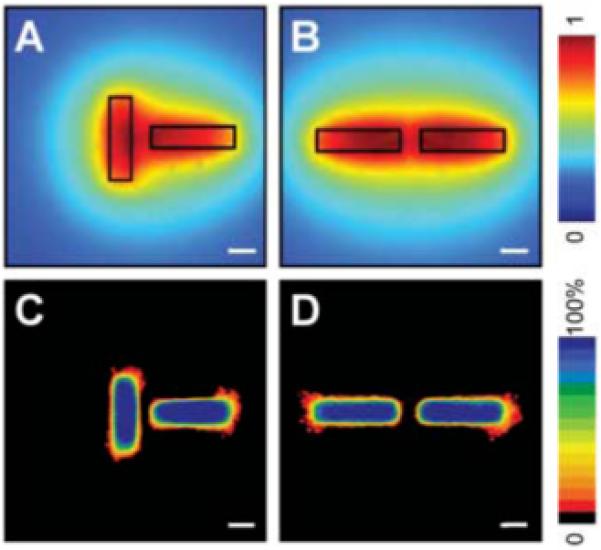
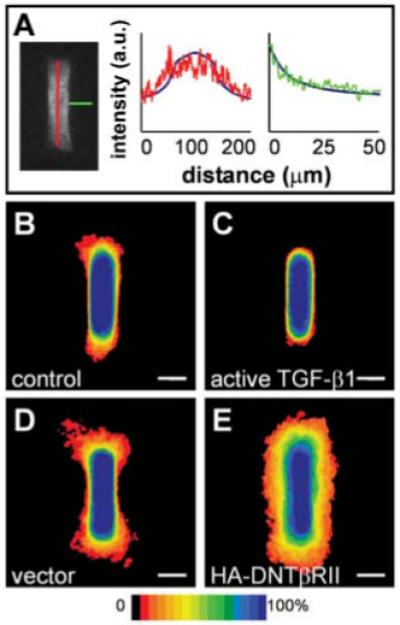
The treelike structures of many organs, including the mammary gland, are generated by branching morphogenesis, a reiterative process of branch initiation and invasion from a preexisting epithelium. Using a micropatterning approach to control the initial three-dimensional structure of mouse mammary epithelial tubules in culture, combined with an algorithm to quantify the extent of branching, we found that the geometry of tubules dictates the position of branches. We predicted numerically and confirm experimentally that branches initiate at sites with a local minimum in the concentration of autocrine inhibitory morphogens, such as transforming growth factor-beta. These results reveal that tissue geometry can control organ morphogenesis by defining the local cellular microenvironment, a finding that has relevance to control of invasion and metastasis.


Figures

Fig. 1
Fig. 1
Characteristics of branching from engineered mammary epithelial tubules. (A) Schematic of 3D microfabrication method to engineer tubules. (B) Phase contrast image and (C) confocal image of tubules stained for actin (green) and nuclei (blue) before induction of branching. The position of cells was quantified by (D) stacking images of nuclei from 50 tubules to generate (E) a frequency map before induction of branching. (F) Phase contrast image and (G) frequency map of tubules 24 hours after adding EGF to induce branching. (H) Confocal image of tubule of primary mammary epithelial cells stained for luminal epithelial keratin-8 (green), myoepithelial keratin-14 (red), and nuclei (blue); (inset) shows z section through tubule. (I) Frequency map of primary mammary epithelial tubules 24 hours after adding EGF. (J) Fluorescent image of vimentin gene promoter-GFP (green) and nuclei (blue) and (K) frequency map of vimentin gene promoter-GFP expression 8 hours after adding EGF. Scale bars, 50 μm.
Fig. 2
Fig. 2
Branching position is determined by tubule geometry and is consistent with the concentration profile of secreted diffusible inhibitor(s). Frequency maps 24 hours after induction of branching for (A) curved tubules, (B) bifurcated tubules, and immunofluorescence staining of actin (red) and nuclei (green) of (C) fractal trees. Branch sites in (C) are denoted by arrows; image stitched from multiple fields. Calculated concentration profiles of diffusible inhibitors for (D) curved tubules, (E) bifurcated tubules, and (F) fractal trees predict lowest local concentration of inhibitors where branching was found to be induced experimentally. Scale bars, 50 μm.
Fig. 3
Fig. 3
Position of branching can be predicted by calculated concentration profile. Calculated profiles of diffusible inhibitors in tubules oriented perpendicular (A) and parallel (B) to each other. Frequency maps 24 hours after induction of branching confirm that branching is inhibited in regions predicted to be surrounded by a high concentration of inhibitors in perpendicular (C) and parallel (D) tubules. Scale bars, 50 μm.
Fig. 4
Fig. 4
Inhibitory activity is mediated in part by autocrine TGFβ in cultured cells. (A) Confocal section of primary mammary epithelial tubule stained for TGFβ1, with graphs representing relative pixel intensity (arbitrary units, a.u.) as a function of distance along tubules (red) and away from tubules (green). Numerical predictions are superimposed as solid blue curves to fit the intensity range. Frequency maps 24 hours after induction of branching in tubules of (B) control cells and (C) cells overexpressing active TGFβ1 confirm that TGFβ1 inhibits branching. (D and E) Positional control of branching is disrupted by blocking signaling of endogenous TGFβ1. Shown are frequency maps 24 hours after induction of branching in tubules of (D) vector control cells and (E) cells overexpressing dominant negative TGFβ receptor type II (HA-DNTβRII). Scale bars, 50 μm.

References

    1. Simian M, et al. Development. 2001;128:3117. - PMC - PubMed
    1. Wiseman BS, et al. J. Cell Biol. 2003;162:1123. - PMC - PubMed
    1. Sakai T, Larsen M, Yamada KM. Nature. 2003;423:876. - PubMed
    1. Weaver M, Dunn NR, Hogan BL. Development. 2000;127:2695. - PubMed
    1. Daniel CW, Smith GH. J. Mammary Gland Biol. Neoplasia. 1999;4:3. - PubMed

Publication types

MeSH terms

Substances