. 2006 Sep 30;353(2):268-82.
doi: 10.1016/j.virol.2006.04.043.

A group M consensus envelope glycoprotein induces antibodies that neutralize subsets of subtype B and C HIV-1 primary viruses

Affiliations

A group M consensus envelope glycoprotein induces antibodies that neutralize subsets of subtype B and C HIV-1 primary viruses

Hua-Xin Liao et al. Virology. .

Abstract

HIV-1 subtype C is the most common HIV-1 group M subtype in Africa and many parts of Asia. However, to date HIV-1 vaccine candidate immunogens have not induced potent and broadly neutralizing antibodies against subtype C primary isolates. We have used a centralized gene strategy to address HIV-1 diversity and generated a group M consensus envelope gene with shortened consensus variable loops (CON-S) for comparative studies with wild-type (WT) Env immunogens. Our results indicate that the consensus HIV-1 group M CON-S Env elicited cross-subtype neutralizing antibodies of similar or greater breadth and titer than the WT Envs tested, indicating the utility of a centralized gene strategy. Our study also shows the feasibility of iterative improvements in Env immunogenicity by rational design of centralized genes.


Figures
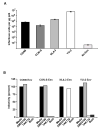
Figure 1
Figure 1
Infectivity and coreceptor usage of CON-S gp160-pseudotyped virus. A. Infectivity in TZM-bl cells. Virus stocks were generated in 293T cells by cotransfection of consensus (CON6 and CON-S) and wildtype Envs (NL4-3, YU-2) with the HIV-1/SG3Δenv backbone (No Env) . Infectivity was determined by counting the number of blue cells (infectious units, IU) per microgram of p24 of pseudovirion stock (IU/μg p24) after staining the infected cells for β-galactosidase expression. Bars indicate standard errors (values are averaged from three independent experiments). B. Coreceptor usage of CON-S Env (gp160) containing pseudovirions. TZM-bl (JC53-BL) cells were pretreated with ADM3100 (CXCR4 inhibitor), TAK-779 (CCR5 inhibitor), both or neither (media) before being infected with CON6, CON-S, NL4-3 and YU-2 Env containing pseudovirions.
Figure 2
Figure 2
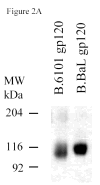
SDS-PAGE and blue native gel analysis of HIV-1 envelope proteins. Panel A shows the results of SDS-PAGE analysis of HIV-1 B.6101 and B.BaL gp120 proteins. HIV-1 gp120 proteins, as indicated on the top of the gel, were fractionated on 4–20% gradient SDS-PAGE under reducing conditions and stained by Coomassie blue. Panel B shows the results of blue native gel analysis of HIV-1 Env gp140 proteins with HIV-1 gp140 proteins indicated on the top of the 3–8% polyacrylamide gels and protein bands of molecular weight markers of 669 (Thyroglobulin), 440 (ferritin), 232 (catalase), 140 (lactate dehydrogenase) and 66 (albumin) kDa indicated on the right hand side of the gel. Arrowheads indicate HIV-1 protein forms (Panel B). Panel C shows SDS-PAGE analysis of the uncleaved HXB2 gp120 Env as a control versus A.92RW020 gp140ΔCF that is approximately 40% cleaved. Gel shows the results of HXB2 gp120 and A.92RW020 gp140ΔCF analyzed under reducing conditions in SDS-PAGE followed by Coomassie blue staining. In this gel, 96kDa band of A.92RW020 Env represents approximately 40% of this preparation. Analysis of 3 separate lots of purified A.92RW020 Env revealed the 96kDa fragment to be 39± 13% of the Env protein preparation.
Figure 2
Figure 2
SDS-PAGE and blue native gel analysis of HIV-1 envelope proteins. Panel A shows the results of SDS-PAGE analysis of HIV-1 B.6101 and B.BaL gp120 proteins. HIV-1 gp120 proteins, as indicated on the top of the gel, were fractionated on 4–20% gradient SDS-PAGE under reducing conditions and stained by Coomassie blue. Panel B shows the results of blue native gel analysis of HIV-1 Env gp140 proteins with HIV-1 gp140 proteins indicated on the top of the 3–8% polyacrylamide gels and protein bands of molecular weight markers of 669 (Thyroglobulin), 440 (ferritin), 232 (catalase), 140 (lactate dehydrogenase) and 66 (albumin) kDa indicated on the right hand side of the gel. Arrowheads indicate HIV-1 protein forms (Panel B). Panel C shows SDS-PAGE analysis of the uncleaved HXB2 gp120 Env as a control versus A.92RW020 gp140ΔCF that is approximately 40% cleaved. Gel shows the results of HXB2 gp120 and A.92RW020 gp140ΔCF analyzed under reducing conditions in SDS-PAGE followed by Coomassie blue staining. In this gel, 96kDa band of A.92RW020 Env represents approximately 40% of this preparation. Analysis of 3 separate lots of purified A.92RW020 Env revealed the 96kDa fragment to be 39± 13% of the Env protein preparation.
Figure 3
Figure 3
Analysis of antigenic epitopes expressed on CON-S gp140ΔCFI by surface plasmon resonance assays. Surface plasmon resonance assays were performed as described in Materials and Methods. Panel A shows the ability of CON-S gp140 CFI to bind to sCD4, MAbs A32 and T8.. sCD4 or HIV-1 MAbs T8 and A32 were covalently immobilized to a CM5 sensor chip (BIAcore), and CON-S gp140 CFI was injected over each surface (100 and 300 ug/ml, respectively). To determine induction of 17b MAb binding to CON-S gp140ΔCFI, CON-S gp140ΔCFI protein was captured (400 to 580 response units) on individual flow cells immobilized with sCD4 or MAb A32 or T8. Following stabilization of each of the surfaces, MAb 17b was injected and allowed to flow over each of the immobilized flow cells (Panel B). To determine binding of CON-S gp140ΔCFI protein to human HIV-1 MAbs, CON-S gp140ΔCFI protein was captured (400 to 580 response units) on individual flow cells immobilized with MAb T8. Following stabilization of each of the surfaces, the indicated human MAb 7B2, 2G12, 4E10b or irrelevant control MAb P3 was injected to flow over each of the immobilized flow cells (Panel C). Each analysis was performed at least twice.
Figure 4
Figure 4
Amino acid differences in CON6 gp140ΔCFI and CON-S gp140ΔCFI. Differences were indicated using single letter code. Positions of a.a. are indicated by numbers beneath the amino acids. The dashed line(s) indicate the deletion of a.a. at the position. Amino acid differences in the Env variable loops are shown in boxes.
Figure 5
Figure 5
Specificity of neutralization activity of anti-CON-S and anti-CON6 guinea pig sera. Absorption assays were performed as described in the Materials and Methods. Results were plotted on y axis as mean % of neutralization activity remaining after absorption of 4 serum samples with the indicated CON-S or CON6 V1, V2, V3, V4, and V5 peptides (V1–V5 CON-S or CON6). The error bars indicated the standard error deviations. Panel A shows the neutralization activity against six HIV-1 primary isolates by anti-CON-S sera after absorption with CON-S variable loop peptides or CON6 V3 peptide as indicated in the bottom of the column plots. Panel B shows the neutralization activity against B.SS1196 by anti-CON6 sera after absorption with CON6 variable loop peptides. Panel C shows the neutralization activity against B.SS1196 by anti-CON6 sera after absorption with CON-S V3 variable loop peptides.
Figure 5
Figure 5
Specificity of neutralization activity of anti-CON-S and anti-CON6 guinea pig sera. Absorption assays were performed as described in the Materials and Methods. Results were plotted on y axis as mean % of neutralization activity remaining after absorption of 4 serum samples with the indicated CON-S or CON6 V1, V2, V3, V4, and V5 peptides (V1–V5 CON-S or CON6). The error bars indicated the standard error deviations. Panel A shows the neutralization activity against six HIV-1 primary isolates by anti-CON-S sera after absorption with CON-S variable loop peptides or CON6 V3 peptide as indicated in the bottom of the column plots. Panel B shows the neutralization activity against B.SS1196 by anti-CON6 sera after absorption with CON6 variable loop peptides. Panel C shows the neutralization activity against B.SS1196 by anti-CON6 sera after absorption with CON-S V3 variable loop peptides.

References

    1. Andre S, Seed B, Eberle J, Schraut W, Bultmann A, Haas J. Increased immune response elicited by DNA vaccination with a synthetic gp120 sequence with optimized codon usage. J Virol. 1998;72:1497–503. - PMC - PubMed
    1. Alam S, Paleos C, Liao HX, Scearce R, Robinson J, Haynes B. An inducible HIV type 1 gp41 HR-2 peptide-binding site on HIV type 1 envelope gp120. AIDS Res Hum Retroviruses. 2004;20(8):836–845. - PubMed
    1. Barnett S, Lu S, Srivastava I, Cherpelis S, Gettie A, Blanchard J, Wang S, Mboudjeka I, Leung L, Lian Y, Fong A, Buckner C, Ly A, Hilt S, Ulmer J, Wild C, Mascola J, Stamatatos L. The Ability of an Oligomeric Human Immunodeficiency Virus Type 1 (HIV-1) Envelope Antigen To Elicit Neutralizing Antibodies against Primary HIV-1 Isolates Is Improved following Partial Deletion of the Second Hypervariable Region. J Virol. 2001;75:5526–5540. - PMC - PubMed
    1. Bures R, Gaitan A, Zhu T, Graziosi C, McGrath KM, Tartaglia J, Caudrelier P, El Habib R, Klein M, Lazzarin A, Stablein DM, Deers M, Corey L, Greenberg ML, Schwartz DH, Montefiori DC. Immunization with recombinant canarypox vectors expressing membrane-anchored gp120 followed by gp160 protein boosting fails to generate antibodies that neutralize R5 primary isolates of human immunodeficiency virus type 1. AIDS Res Hum Retroviruses. 2000;16:2019–2035. - PubMed
    1. Chakrabarti BK, Kong WP, Wu BY, Yang ZY, Friborg J, Ling X, King SR, Montefiori DC, Nabel GJ. Modifications of the human immunodeficiency virus envelope glycoprotein enhance immunogenicity for genetic immunization. J Virol. 2002;76(11):5357–68. - PMC - PubMed

Publication types

Substances

LinkOut - more resources