

doi: 10.1111/j.1542-474X.2006.00127.x.
Bundle-branch block with short P-R interval in healthy young people prone to paroxysmal tachycardia. 1930
- PMID: 17040283
- PMCID: PMC6932258
- DOI: 10.1111/j.1542-474X.2006.00127.x
Item in Clipboard
Bundle-branch block with short P-R interval in healthy young people prone to paroxysmal tachycardia. 1930
Ann Noninvasive Electrocardiol.
2006 Oct.
No abstract available
Figures
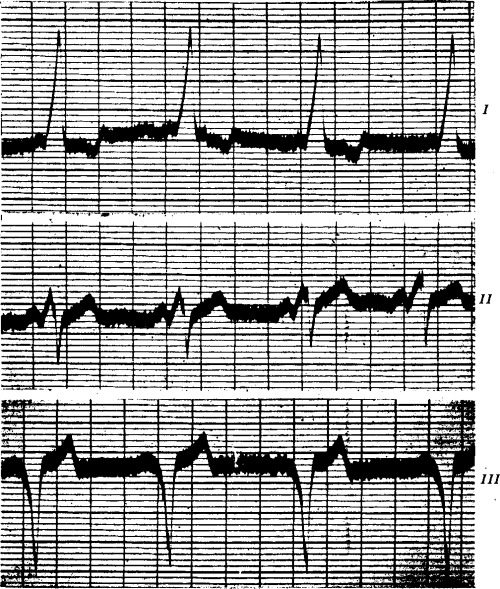
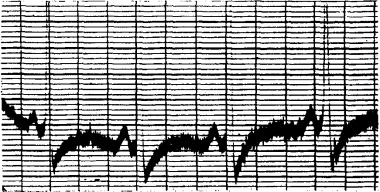
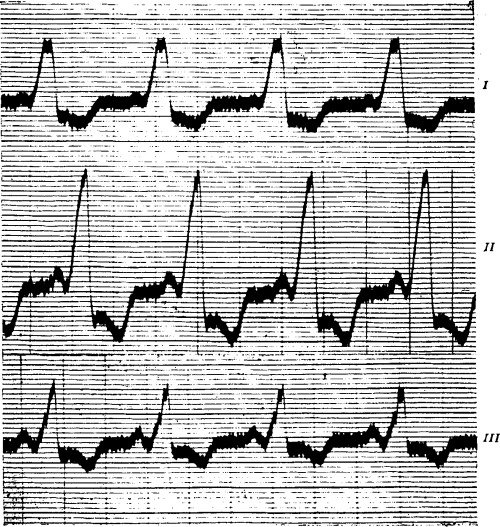
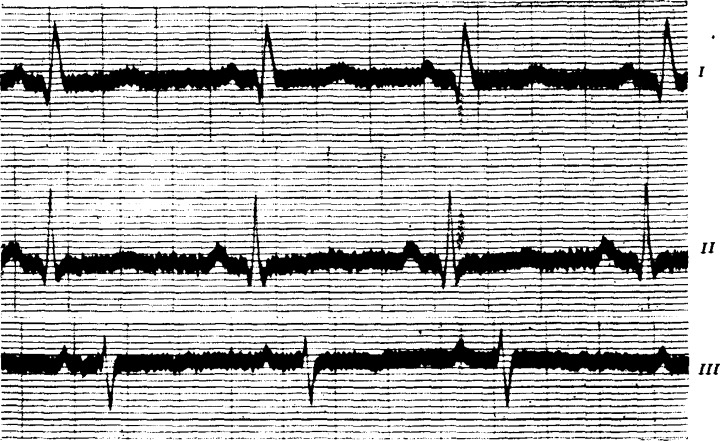
(Case I) Right bundle‐branch block. The P‐R interval is 0.1 second. The rate is 72. Time intervals for this and succeeding figures = 0.2 second. Horizontal lines cut off intervals of 10−4 volt.
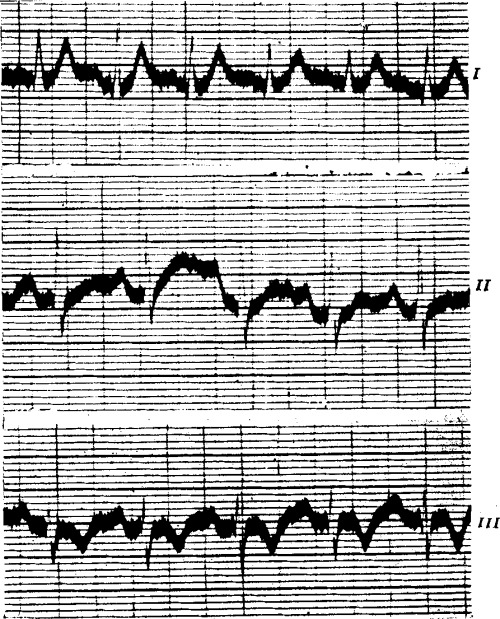
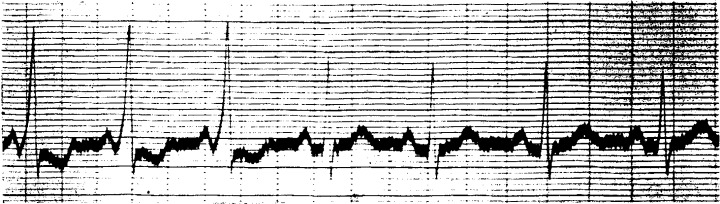
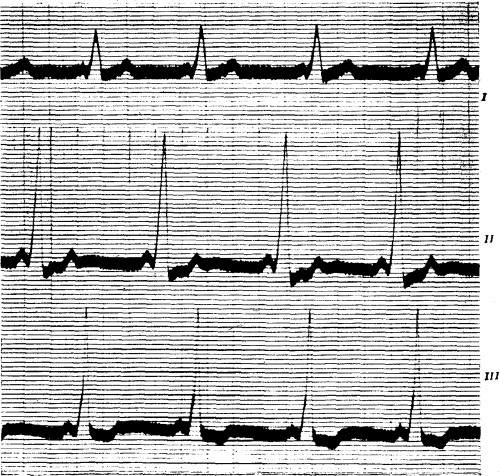
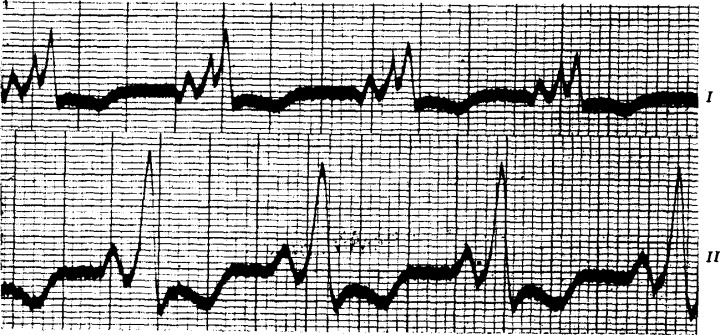
(Case I) Immediately after exercise (running up and down four flights of stairs). Sino‐auricular tachycardia, rate 140 to 120. The ventricular complexes are normal, the P‐waves are better marked, and the P‐R interval is 0.16 second.
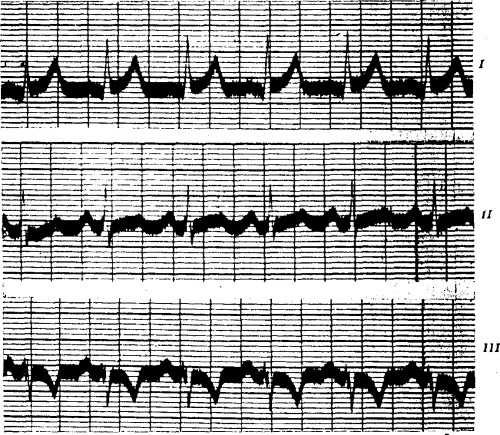
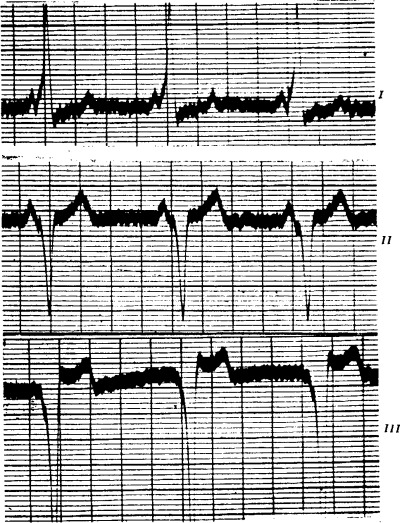
(Case I) One hour after the subcutaneous injection of 1/30 grain of atropine sulphate. The rate is 140, the ventricular complexes are normal, and the P‐R interval is 0.15 to 0.16 second.
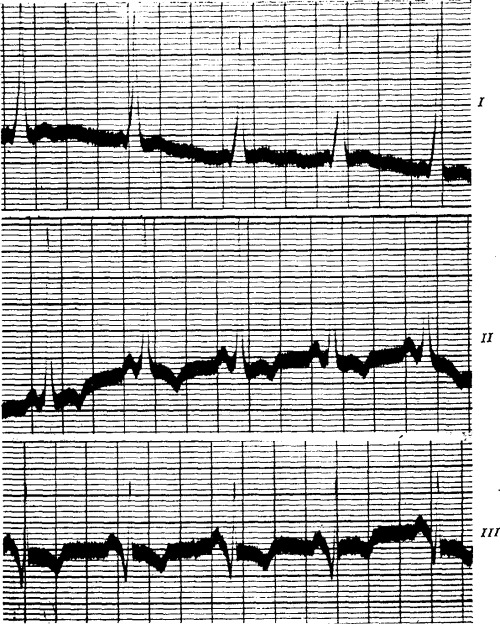
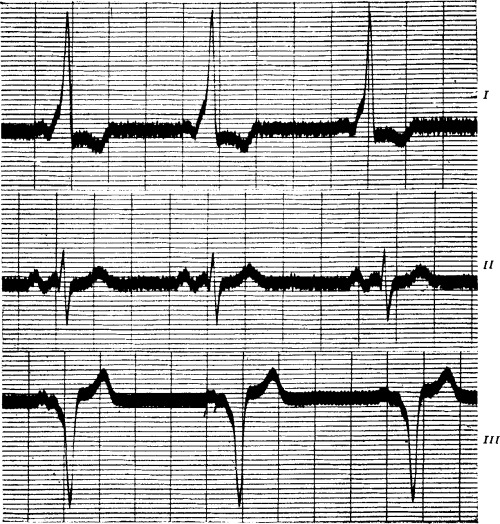
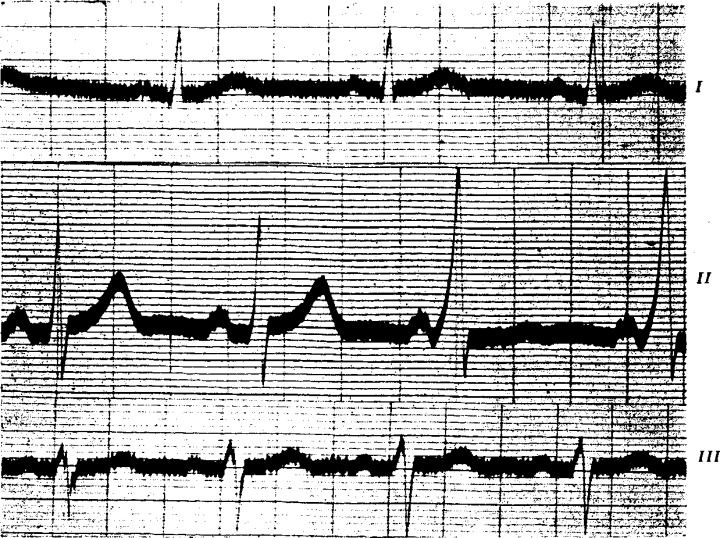
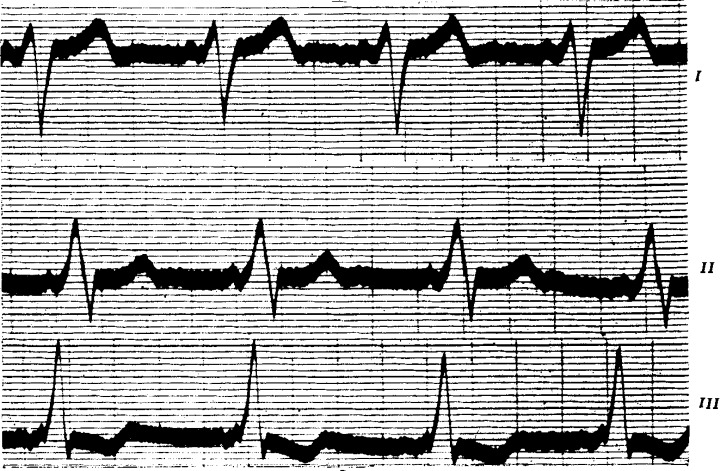
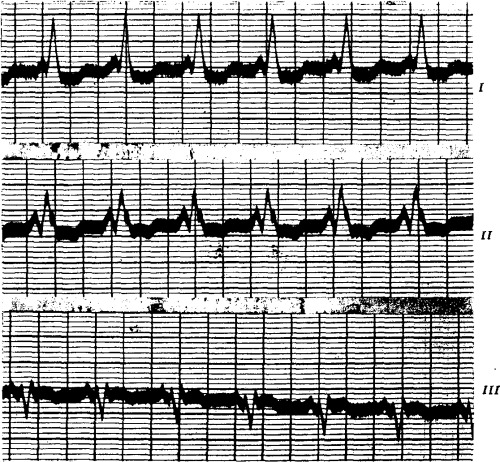
(Case II) Intraventricular block. The P‐R interval is 0.1 second. Rate 96.
(Case II) Immediately after exercise. The ventricular complexes are normal except for deformity of the S wave and S‐T interval by artefact (high resistance, resulting in over‐shooting). The T‐wave is upright. The P‐R interval is 0.15 second. Rate 96.
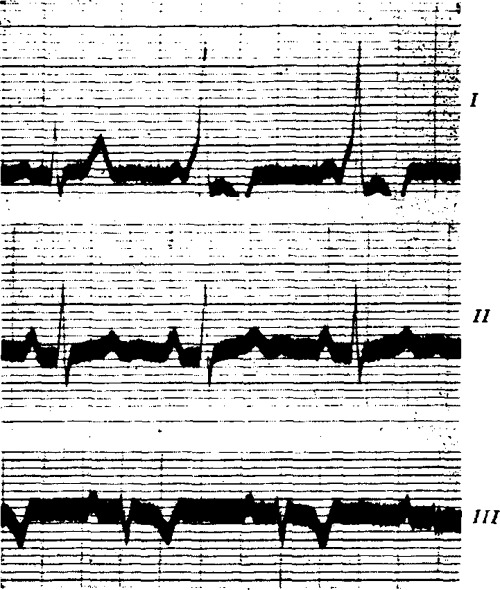
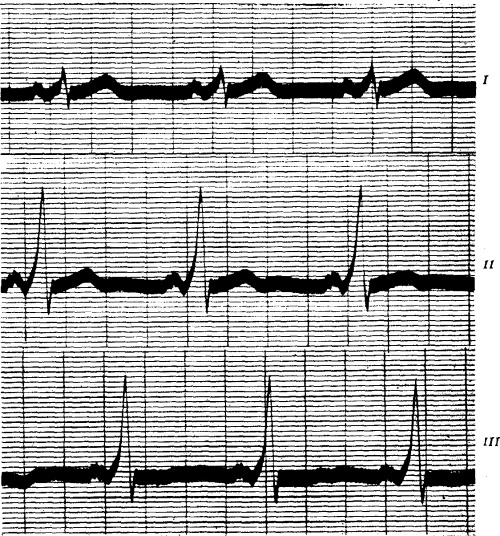
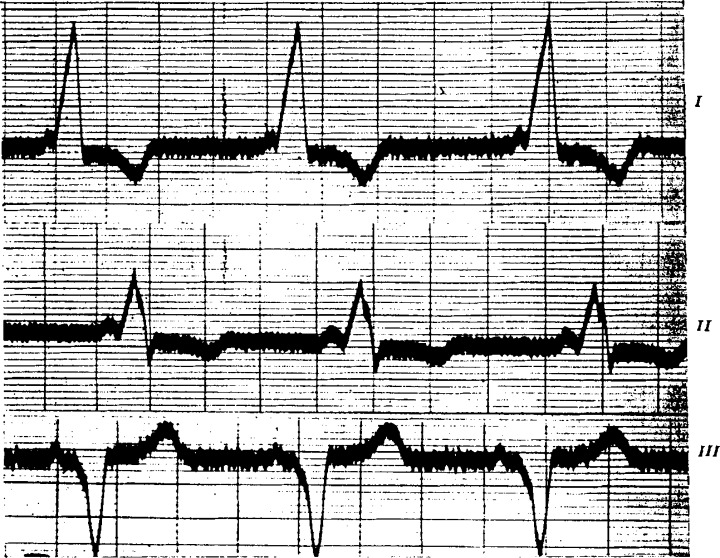
(Case III) Right bundle‐branch block. The P‐R interval is well under 0.1 second. The rate varies between 60 and 70.
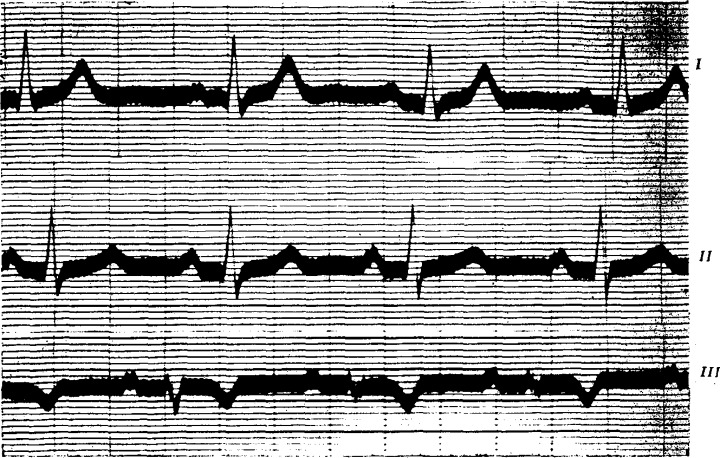
(Case III) After a paroxysm of tachycardia lasting seven hours. The ventricular complexes are normal, but occasionally there is reversion to the abnormal form. The P‐R interval is almost 0.2 second. The P‐waves are notched, and identical in Figs. 6 and 7.
(Case III) Two years after Fig. 6 was taken. Normal physiological curves.
(Case IV) Spontaneous reversion from bundle‐branch block curves to normal ones. The form of the P‐wave remains unaltered, but the P‐R interval changes from 0.09 second to 0.15 second.
(Case IV) Normal physiological complexes. P‐R interval 0.15 second. In Lead II there is a transition to the abnormal form and short P‐R interval.
(Case IV) Bundle‐branch block. The P‐R interval is less than 0.1 second. The P‐waves are identical in Figs. 10 and 11: note the peculiar notching of the P‐waves.
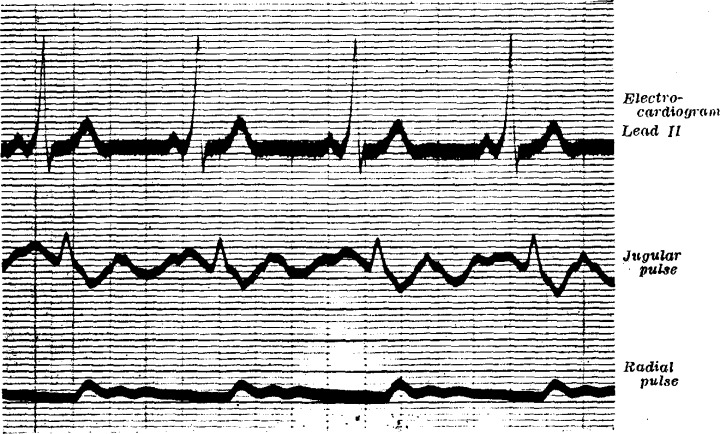
(Case IV) Simultaneous electrocardiogram and jugular and radial tracings. Bundle‐branch block curves are present. The a. c. v. h. sequence is normal.
(Case V) Intraventricular block. The P‐waves are normal and upright in all leads. The P‐R interval is well under 0.1 second.
(Case VI) Intraventricular block. The P‐waves are normal and upright in all leads. The P‐R interval is well under 0.1 second.
(Case VII) Left bundle‐branch block. The P‐waves are normal and upright in all leads. The P‐R interval is well under 0.1 second.
(Case VIII) Right bundle‐branch block. The P‐R interval is well under 0.1 second.
(Case VIII) Three years later. Normal physical curves. The P‐R interval is 0.16 second. The P‐waves are identical in Figs. 16 and 17.
(Case IX) Intraventricular block. The P‐R interval is 0.1 second. Time intervals = 0.2 and 0.04 seconds.
(Case X) Intraventricular block. The P‐R interval is 0.1 second.
(Case XI) Intraventricular block. The P‐R interval is less than 0.1 second.
References
-
- Carter, E. P .: Clinical Observations on Defective Conduction in the Branches of the Auriculo‐Ventricular Bundle. Arch. Int. Med., 13, 803, 1914.
-
- Cohn, A. E. , and Lewis, T .: The Pathology of Bundle‐Branch Lesions of the Heart. Proc. N. Y. Path. Soc., 14, 207, 1914.
-
- Eppinger, H. , Und Rothberger, J .: Zur Analyse des Elektrokardiogramms. Wien Klin. Wchnschr., 22, 1091,1909.
-
- Eppinger, H. , Und Rothberger, J .: Ueber die Folgen der Durchschneidung der Tawaraschen Schenkel des Reizleitungssystems. Ztschr. f. klin. Med., 70, 1, 1910.
-
- Eppinger, H. , Und Stoerk, O. : Zur Klinik des Elektrokardiogramms. Ztschr. f. klin. Med., 71, 157, 1910.
Publication types
MeSH terms
Personal name as subject
- Actions
- Actions
- Actions
LinkOut - more resources
Full Text Sources
Research Materials
