. 2006 Oct 13:2:32.
doi: 10.1186/1744-8069-2-32.

Reduction of anion reversal potential subverts the inhibitory control of firing rate in spinal lamina I neurons: towards a biophysical basis for neuropathic pain

Affiliations

Reduction of anion reversal potential subverts the inhibitory control of firing rate in spinal lamina I neurons: towards a biophysical basis for neuropathic pain

Steven A Prescott et al. Mol Pain. .

Abstract

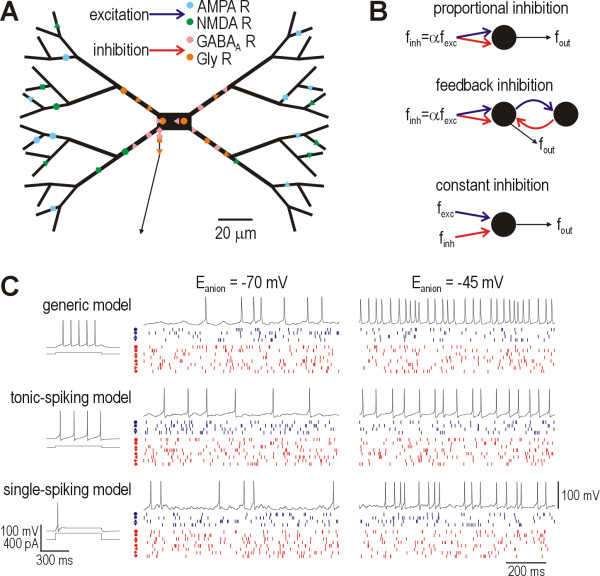
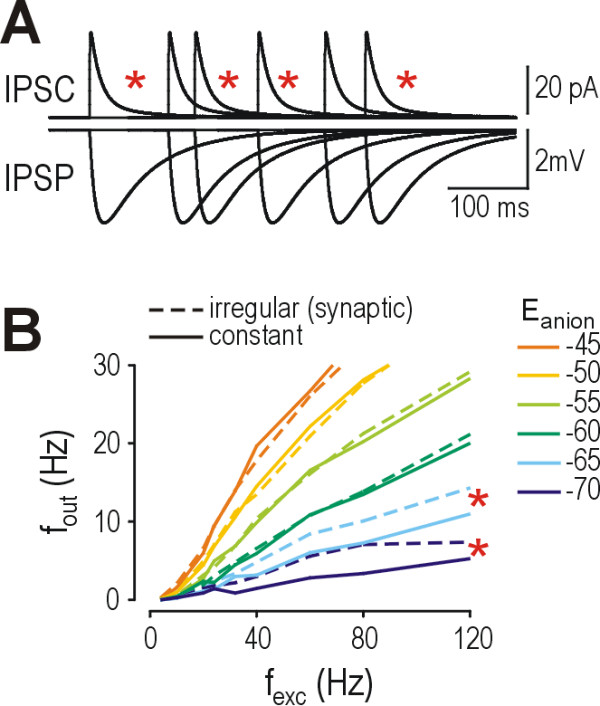
Background: Reduction of the transmembrane chloride gradient in spinal lamina I neurons contributes to the cellular hyperexcitability producing allodynia and hyperalgesia after peripheral nerve injury. The resultant decrease in anion reversal potential (i.e. shift in Eanion to less negative potentials) reduces glycine/GABAA receptor-mediated hyperpolarization, but the large increase in membrane conductance caused by inhibitory input can nonetheless shunt concurrent excitatory input. Without knowing the relative contribution of hyperpolarization and shunting to inhibition's modulation of firing rate, it is difficult to predict how much net disinhibition results from reduction of Eanion. We therefore used a biophysically accurate lamina I neuron model to investigate quantitatively how changes in Eanion affect firing rate modulation.

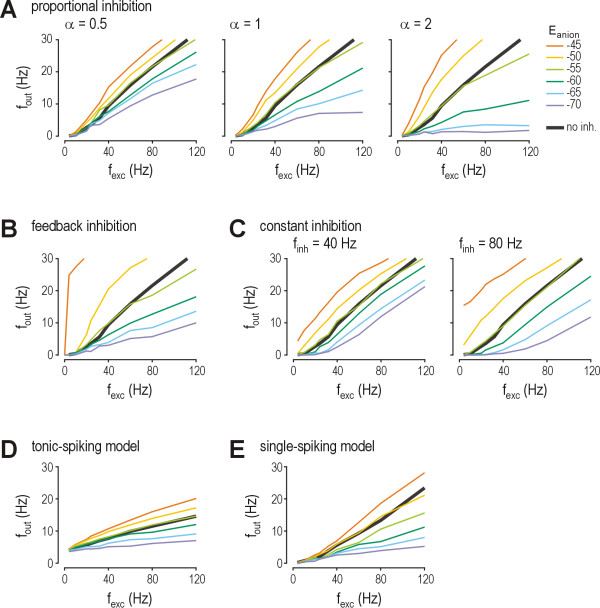
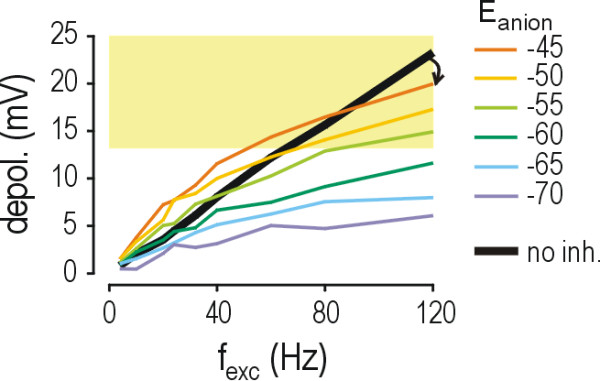
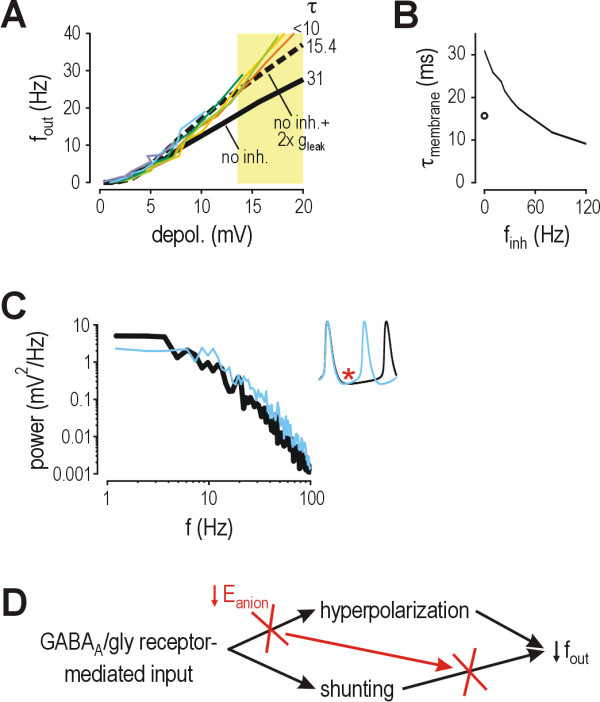
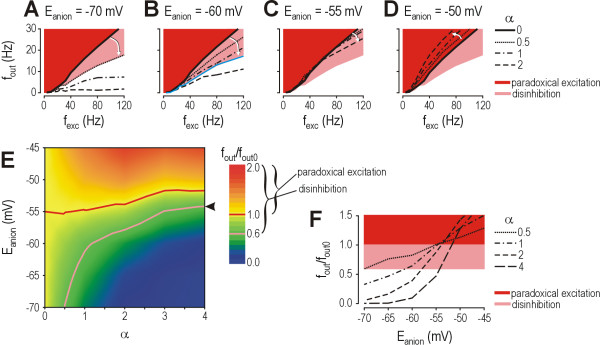
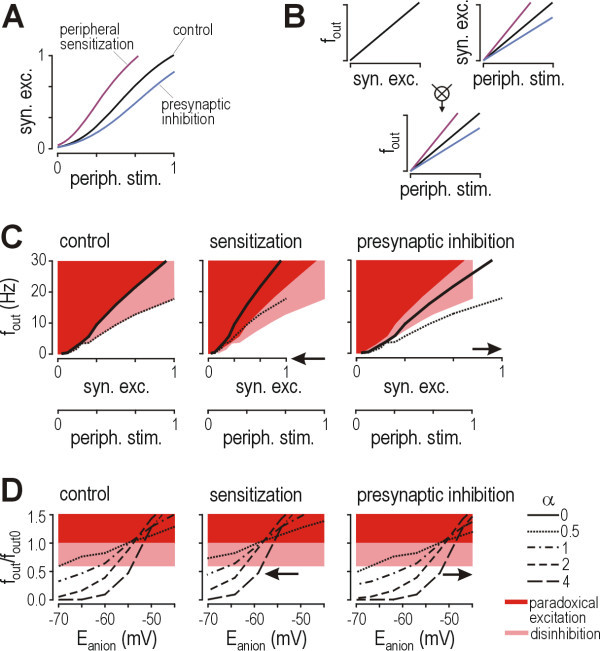
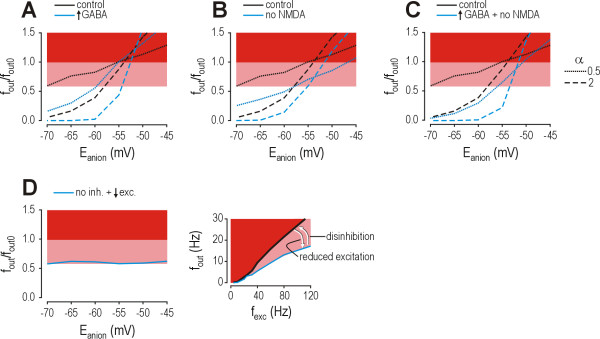
Results: Simulations reveal that even a small reduction of Eanion compromises inhibitory control of firing rate because reduction of Eanion not only decreases glycine/GABAA receptor-mediated hyperpolarization, but can also indirectly compromise the capacity of shunting to reduce spiking. The latter effect occurs because shunting-mediated modulation of firing rate depends on a competition between two biophysical phenomena: shunting reduces depolarization, which translates into reduced spiking, but shunting also shortens the membrane time constant, which translates into faster membrane charging and increased spiking; the latter effect predominates when average depolarization is suprathreshold. Disinhibition therefore occurs as both hyperpolarization- and shunting-mediated modulation of firing rate are subverted by reduction of Eanion. Small reductions may be compensated for by increased glycine/GABAA receptor-mediated input, but the system decompensates (i.e. compensation fails) as reduction of Eanion exceeds a critical value. Hyperexcitability necessarily develops once disinhibition becomes incompensable. Furthermore, compensation by increased glycine/GABAA receptor-mediated input introduces instability into the system, rendering it increasingly prone to abrupt decompensation and even paradoxical excitation.

Conclusion: Reduction of Eanion dramatically compromises the inhibitory control of firing rate and, if compensation fails, is likely to contribute to the allodynia and hyperalgesia associated with neuropathic pain. These data help explain the relative intractability of neuropathic pain and illustrate how it is important to choose therapies not only based on disease mechanism, but based on quantitative understanding of that mechanism.


Figures

Figure 1
Figure 1
The model neuron and its synaptic connectivity. (A) The model neuron comprises a soma, 60 dendritic compartments, and an axon; only the most proximal section of the axon is illustrated. Sites of synaptic inputs are shown for conditions corresponding to perisomatic inhibition; another, more uniform distribution of inhibitory synapses was tested (see Methods) but is not illustrated here. Each symbol (circle, square, etc.) denotes membership to a different set of excitatory or inhibitory synapses; synapses in each set receive common input. (B) These panels explain the synaptic connectivity responsible for inhibition. Firing rate in the output neuron is denoted fout. With proportional inhibition, the rate of inhibitory input (finh) is proportional to the rate of excitatory input (fexc) with a constant of proportionality α. With feedback inhibition, the output neuron, which itself receives both excitatory and inhibitory input, excites a feedback neuron that inhibits the output neuron. Since the feedback neuron has the same intrinsic properties as the output neuron, and since a spike in the latter typically elicits a spike in the former, firing rate in the feedback neuron is roughly equal to that in the output neuron. With constant inhibition, finh is independent of fexc. (C) Sample responses are shown for each of the three sets of intrinsic membrane properties tested. Panel immediately below each label depicts the response of the model neuron to a 500 ms-long current step injected into the soma. Other panels show responses to random synaptic input (fexc = finh = 80 Hz) for Eanion = -70 mV (left) and -45 mV (right). The voltage response in the model neuron is shown together with the timings of synaptic events in each set of synapses; symbols for each synaptic set correspond to those in part A while color is simply dark blue (excitation) or red (inhibition) because some synaptic sets have more than one type of synapse (e.g. AMPA and NMDA).
Figure 2
Figure 2
Reduction of Eanion compromises inhibitory control of firing rate. Output firing rate (fout) is plotted against the total rate of EPSPs received from all presynaptic neurons (fexc) for different values of Eanion tested at 5 mV increments from -70 mV (purple) to -45 mV (orange). The fout-fexc curve for no inhibition (α = 0) is shown as a thick black line on each panel. Parts A-C are based on simulations in the basic model. (A) With proportional inhibition, finh = α fexc. Each panel shows results for a different value of α. Divergence of the colored curves increases as α increases. (B) Feedback inhibition was added to proportional inhibition with α = 0.5. Incorporating feedback inhibition had much the same effect as increasing α under conditions with pure proportional inhibition (see part A) except that, with feedback inhibition, the increased divergence of the colored fout-fexc curve was particularly pronounced for Eanion = -50 and -45 mV. This is because those values of Eanion cause paradoxical excitation, meaning feedback inhibition actually becomes feedback excitation (i.e. a positive feedback loop), which makes for an extremely hyperexcitable system. (C) The final two panels show constant inhibition (i.e. finh is independent of fexc). Under these conditions, the fout-fexc curves tend to remain parallel rather than diverge with increasing fexc, but increasing finh nonetheless increases the vertical spacing of those curves. Comparing across parts A-C shows that reduction of Eanion has a similar effect on inhibitory control of firing rate for all three conditions. The fout-fexc curves for Eanion = -50 and -45 mV (yellow and orange) exhibit paradoxical excitation since they lie above the fout-fexc curve for no inhibition (black). The fout-fexc curve for Eanion = -55 mV (light green) exhibits complete disinhibition since it lies very close to the fout-fexc curve for no inhibition. The fout-fexc curves for Eanion = -60 and -65 mV (dark green and blue) exhibit modest disinhibition since they lie below the fout-fexc curve for no inhibition but above the fout-fexc curve for Eanion = -70 mV (purple). Based on proportional inhibition with α = 1, simulations were repeated in the tonic-spiking model (D) and in the single-spiking model (E). Although the fout-fexc curves vary between cell types (compare also with basic model in part A), the more important comparison is between curves for different Eanion within a specific cell type: in the basic and tonic-spiking models, reduction of Eanion to -55 mV causes complete disinhibition, while complete disinhibition in the single-spiking model seems to require a slightly greater reduction, to around -50 mV.
Figure 3
Figure 3
Shunting has a much greater impact on depolarization than it does on firing rate. These data are based on simulations in the model neuron with Hodgkin-Huxley (HH) channels removed so as to prevent spiking and thereby allow measurement of the underlying depolarization. Yellow shading shows suprathreshold voltages. α = 1. Unlike the nearly linear fout-fexc curves seen in Figure 2, the depol-fexc curves with inhibition (colored) are clearly sublinear (i.e. bend downwards). This sublinearity is not seen in the depol-fexc curve without inhibition (black). At low fexc, depolarization is paradoxically enhanced by inhibitory input with Eanion = -50 and -45 mV (i.e. the yellow and orange curves lie above the black curve on the left side of the graph) but, because of the sublinearity in those curves, at high fexc, depolarization is reduced by inhibitory input (i.e. the yellow and orange curves lie below the black curve on the right side of the graph; arrow) even if that reduction is less than that for inhibition with Eanion = -70 mV.
Figure 4
Figure 4
Reduction of the membrane time constant (τmembrane) caused by increased membrane conductance allows for faster spiking. (A) For this graph, fout produced by a given value of fexc (based on simulations with HH channels; Fig. 2A, α = 1) was plotted against depolarization produced by the same value of fexc (based on simulations without HH channels; Fig. 3). The results reveal that, for a given level of depolarization, faster spiking is produced with inhibition than without (compare colored curves with solid black curve). This tendency is unaffected by the value of Eanion and becomes more pronounced with greater depolarization. Yellow shading shows suprathreshold voltages. The increased spiking caused by inhibition is explained by inhibition's reduction of τmembrane (see part B); values of τmembrane for depol ≈ 20 mV are shown along right edge of graph. Indeed, if τmembrane is reduced to an intermediate value by doubling the passive leak conductance in the model neuron, an intermediate relationship between depolarization and fout is found (dashed black curve). (B) Line shows trend in τmembrane as finh increases. Dot shows τmembrane in model neuron after doubling the passive leak conductance. (C) Comparison of power spectra with and without inhibition (blue and black lines, respectively; finh = 80 Hz) reveals the reduced low pass filtering that occurs when τmembrane is shortened; specifically, frequencies greater than ~7 Hz are associated with higher power when the model neuron is shunted. Inset shows that decreased filtering allows faster membrane recharging between spikes, thereby allowing faster spiking. For this example, stimulus intensity was adjusted to produce equal depolarization (based on simulations without HH channels) with and without inhibition, meaning the difference in interspike interval is attributable solely to a change in τmembrane. (D) Reduction of Eanion directly compromises glycine/GABAA receptor-mediated hyperpolarization. Although shunting itself is unaffected by reduction of Eanion, the ability of shunting to modulate firing rate can be indirectly compromised if, because of reduced glycine/GABAA receptor-mediated hyperpolarization, average depolarization remains suprathreshold. In that case, the shunting-induced shortening of τmembrane paradoxically yields faster spiking.
Figure 5
Figure 5
Gaps in inhibition compromise glycine/GABAA receptor-mediated modulation of firing rate only under conditions where shunting can modulate firing rate. (A) Whereas the time course of inhibitory postsynaptic currents (IPSCs) directly parallels the change in membrane conductance, the resultant inhibitory postsynaptic potentials (IPSPs) are much slower because of membrane capacitance. The relative brevity of IPSCs coupled with irregularity in the timing of inputs could allow gaps during which little shunting occurs (red stars). (B) Most fout-fexc curves were unchanged by switching from intermittent inhibition (dashed lines) to constant inhibition (solid lines); the exceptions were those for Eanion = -65 and -70 mV where constant inhibition caused greater reduction in fout than intermittent inhibition. This argues in favor of shunting's ability to modulate firing rate only when average depolarization remains subthreshold (see Results). Constant inhibition was applied as a point conductance in the soma equal to the sum of time-averaged conductances from each inhibitory synapse, repeated at each finh. α = 1.
Figure 6
Figure 6
Compensatory increases in glycine/GABAA receptor-mediated input fail to prevent disinhibition if reduction of Eanion exceeds a critical value. (A) Under normal conditions, Eanion = -70 mV. Inhibition with α = 0.5 compresses the fout-fexc curve as shown by the white arrow, producing an fout/fout0 ratio of approximately 0.6. Reduction of the fout/fout0 ratio to 0.6 represents a conservative estimate of inhibition; higher values of α result in greater compression of the fout-fexc curve and lower fout/fout0 ratios. Using this conservative estimate for illustrative purposes, fout/fout0 > 0.6 (pink region) represents disinhibition while fout/fout0 > 1 (red region) represents paradoxical excitation. (B) If Eanion is reduced to -60 mV, inhibition with α = 0.5 does not reduce fout as much as it did with Eanion = -70 mV; the resulting fout-fexc curve falls inside the pink region, indicative of disinhibition. But if α is increased to 1.2 (blue curve), the fout-fexc curve is returned to the white-pink border, meaning fout/fout0 ≈ 0.6. This demonstrates that disinhibition caused by moderate reduction of Eanion is compensable. (C) If Eanion is reduced to -55 mV, increasing α as high as 2 still fails to shift the fout-fexc curve outside the pink region, demonstrating that disinhibition caused by larger reduction of Eanion becomes incompensable. (D) If Eanion is reduced to -50 mV, increasing α actually shifts the fout-fexc curve into the red region, demonstrating that even larger reductions of Eanion can result in paradoxical excitation. (E) Contour plot show combinations of Eanion and α that produce disinhibition (fout/fout0 > 0.6, demarcated by pink line) and paradoxical excitation (fout/fout0 > 1, demarcated by red line) calculated for fexc = 80 Hz. Arrowheads mark Eanion at which decompensation occurs, assuming α could increase as high as 4. (F) These graphs show cross-sections through the contour plots in part E. Increasing α to 4 prevents disinhibition from occurring until Eanion reduces to -54 mV, but steepening of the curve means that decompensation occurs abruptly (e.g. reduction of Eanion from -55 to -50 mV causes fout/fout0 to nearly triple, increasing from 0.47 to 1.28) whereas disinhibition develops more gradually in the absence of compensation (e.g. with α = 0.5, the same change in Eanion causes fout/fout0 to change from 1.01 to 1.13).
Figure 7
Figure 7
Peripheral sensitization and presynaptic inhibition alter the amount of postsynaptic inhibition necessary to maintain a normal input-output relationship. (A) Synaptic excitation (syn. exc.) of lamina I neurons is assumed to be a sigmoidal function of the strength of peripheral stimulation (periph. stim.); both are expressed on an arbitrary scale between 0 and 1. Peripheral sensitization steepens that function whereas presynaptic inhibition flattens it. The distinction between modulation of the frequency or amplitude of synaptic inputs is irrelevant for the analysis here. (B) The relationship between fout and synaptic excitation (which is equivalent to the fout-fexc relationship) can be combined with the relationship between synaptic excitation and strength of peripheral stimulation to give the relationship between fout and strength of peripheral stimulation. (C) Peripheral sensitization does not change the relationship between fout and synaptic excitation, but it does change the relationship between fout and strength of peripheral stimulation through its effect illustrated in part A. The resulting horizontal compression (left-pointing arrow) forces the fout-periph. stim. curve for α = 0.5 (dotted curve) into the pink region (center panel). This indicates that sensitization has an effect analogous to disinhibition and, by extension, that the neuron must rely on stronger proportional inhibition (i.e. larger α) to maintain a normal input-output relationship. Conversely, presynaptic inhibition causes a horizontal expansion (right-pointing arrow) that forces the fout-periph. stim. curve outside the pink region (right panel); under these conditions, the neuron could rely weaker proportional inhibition (i.e. smaller α) to maintain a normal input-output relationship. (D) Effects of changing Eanion and α in the context of peripheral sensitization and presynaptic inhibition are illustrated here. The fout/fout0 ratio is calculated for fexc = 80 Hz using fout for the test condition and fout0 for the control condition. Thus, fout/fout0 > 0.6 represents hyperexcitability comparable to that produced by disinhibition, while fout/fout0 > 1 is comparable to hyperexcitability produced by paradoxical excitation. Peripheral sensitization shifts the family of curves leftward (center panel) whereas presynaptic inhibition shifts them rightward (right panel); neither process changes the slopes of those curves, in contrast with the effects of changing α.
Figure 8
Figure 8
Therapeutically correcting Eanion-mediated disinhibition by augmenting GABAergic input risks introducing instability into the system, and suggests that other therapeutic interventions may be preferable. The fout/fout0 ratio is calculated for fexc = 80 Hz. (A) Doubling w and τdecay of GABAA receptor-mediated input, as might occur with benzodiazepines, increased the value of Eanion at which decompensation occurred (where curve enters pink region indicating fout/fout0 > 0.6), but it risked exacerbating paradoxical excitation if reduction of Eanion was large. Increasing GABAergic transmission had effects comparable to increasing α (compare with Fig. 6F): with α = 0.5 (dotted curve), increasing GABA approximated effects of increasing α to 1.2 (i.e. increase of 0.7 or 2.4×) while with α = 2 (dashed curve), increasing GABA approximated effects of increasing α to 4.4 (i.e. increase of 2.4 or 2.2×). This demonstrates that strength and frequency of input interact multiplicatively. (B) Unlike modulating inhibitory input, blocking NMDA receptor-mediated excitation shifted the curve relating fout/fout0 and fexc. (C) Combining NMDA antagonism with increased GABAergic transmission had purely additive effects. Augmenting inhibitory input alone or in combination with reducing excitatory input can prevent decompensation until the reduction in Eanion becomes larger than that necessary to produce decompensation without an increase in inhibition. However, there are several complications: 1) decompensation still occurs for large reduction in Eanion; 2) the balance achieved by increasing inhibition is unstable inasmuch as the curve is steep when passing through fout/fout0 = 0.6 meaning small changes in Eanion can cause abrupt decompensation; and 3) for neurons that maintain Eanion = -70 mV, exposure to a benzodiazepine will reduce fout/fout0 significantly below 0.6. (D) One possible solution to these problems is to deliberately block inhibition (upward arrow in graph on right) and counterbalance the consequent increase fout/fout0 by a titrated reduction in excitation (downward arrow). For simulations shown here, GABA, glycine, and NMDA receptor-mediated input were blocked and AMPA receptor-mediated input was decreased until an fout/fout0 ratio of ~0.6 was achieved. By removing inhibition, the fout/fout0 ratio becomes insensitive to Eanion and α, meaning fout/fout0 remains stable despite changes in either variable and, furthermore, variation in Eanion and α between affected and unaffected cells does not influence fout/fout0.

References

    1. Woolf CJ, Salter MW. Neuronal plasticity: increasing the gain in pain. Science. 2000;288:1765–1769. doi: 10.1126/science.288.5472.1765. - DOI - PubMed
    1. Woolf CJ, Mannion RJ. Neuropathic pain: aetiology, symptoms, mechanisms, and management. Lancet. 1999;353:1959–1964. doi: 10.1016/S0140-6736(99)01307-0. - DOI - PubMed
    1. Woolf CJ. Dissecting out mechanisms responsible for peripheral neuropathic pain: implications for diagnosis and therapy. Life Sci. 2004;74:2605–2610. doi: 10.1016/j.lfs.2004.01.003. - DOI - PubMed
    1. Koltzenburg M, Scadding J. Neuropathic pain. Curr Opin Neurol. 2001;14:641–647. doi: 10.1097/00019052-200110000-00014. - DOI - PubMed
    1. Besson JM. The neurobiology of pain. Lancet. 1999;353:1610–1615. doi: 10.1016/S0140-6736(99)01313-6. - DOI - PubMed

Publication types

LinkOut - more resources