

Membrane order and molecular dynamics associated with IgE receptor cross-linking in mast cells
- PMID: 17040981
- PMCID: PMC1697873
- DOI: 10.1529/biophysj.106.088815
Membrane order and molecular dynamics associated with IgE receptor cross-linking in mast cells
Abstract
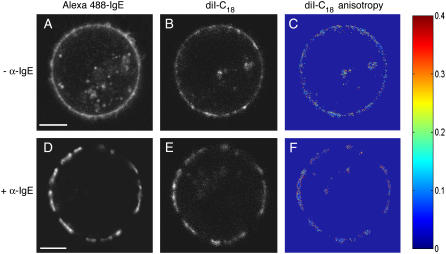
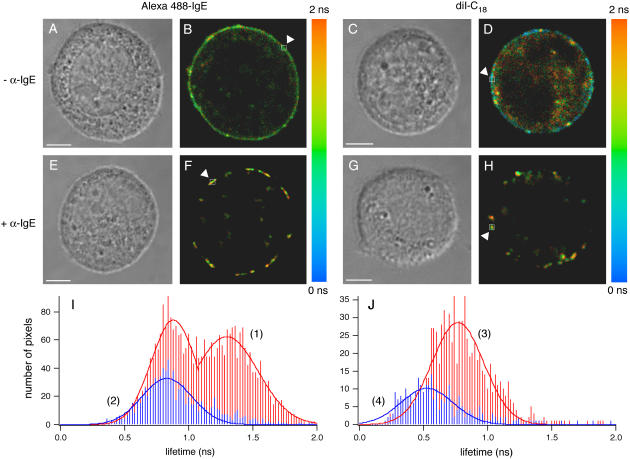
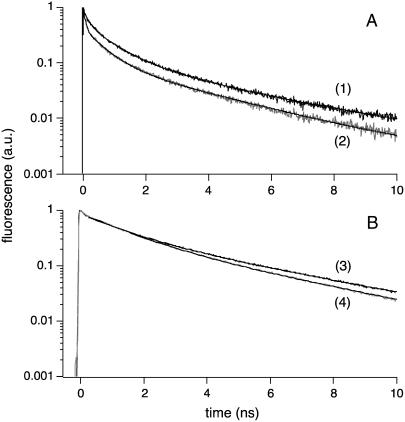
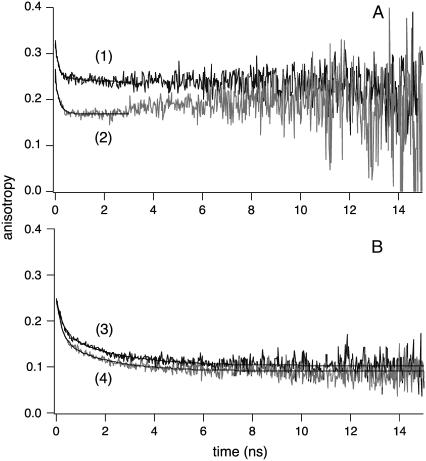
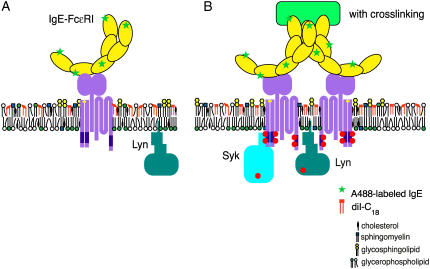
Cholesterol-rich microdomains (or "lipid rafts") within the plasma membrane have been hypothesized to exist in a liquid-ordered phase and play functionally important roles in cell signaling; however, these microdomains defy detection using conventional imaging. To visualize domains and relate their nanostructure and dynamics to mast cell signaling, we use two-photon (760 nm and 960 nm) fluorescence lifetime imaging microscopy and fluorescence polarization anisotropy imaging, with comparative one-photon anisotropy imaging and single-point lifetime and anisotropy decay measurements. The inherent sensitivity of ultrafast excited-state dynamics and rotational diffusion to the immediate surroundings of a fluorophore allows for real-time monitoring of membrane structure and organization. When the high affinity receptor for IgE (FcepsilonRI) is extensively cross-linked with anti-IgE, molecules associated with cholesterol-rich microdomains (e.g., saturated lipids (the lipid analog diI-C(18) or glycosphingolipids)) and lipid-anchored proteins coredistribute with cross-linked IgE-FcepsilonRI. We find an enhancement in fluorescence lifetime and anisotropy of diI-C(18) and Alexa 488-labeled IgE-FcepsilonRI in the domains where these molecules colocalize. Our results suggest that fluorescence lifetime and, particularly, anisotropy permit us to correlate the recruitment of lipid molecules into more ordered domains that serve as platforms for IgE-mediated signaling.
Figures
Similar articles
-
Molecular perspective of antigen-mediated mast cell signaling.J Biol Chem. 2008 Mar 14;283(11):7117-27. doi: 10.1074/jbc.M708879200. Epub 2007 Dec 19. J Biol Chem. 2008. PMID: 18093971
-
Cholesterol sensitivity of detergent resistance: a rapid flow cytometric test for detecting constitutive or induced raft association of membrane proteins.Cytometry A. 2004 Oct;61(2):117-26. doi: 10.1002/cyto.a.20080. Cytometry A. 2004. PMID: 15382146
-
Some new faces of membrane microdomains: a complex confocal fluorescence, differential polarization, and FCS imaging study on live immune cells.Cytometry A. 2008 Mar;73(3):220-9. doi: 10.1002/cyto.a.20516. Cytometry A. 2008. PMID: 18163467
-
Requirements for effective IgE cross-linking on mast cells and basophils.Mol Nutr Food Res. 2006 Jul;50(7):620-4. doi: 10.1002/mnfr.200500272. Mol Nutr Food Res. 2006. PMID: 16764017 Review.
-
Lipid rafts in mast cell signaling.Mol Immunol. 2002 Sep;38(16-18):1247-52. doi: 10.1016/s0161-5890(02)00071-8. Mol Immunol. 2002. PMID: 12217391 Review.
Cited by
-
Plasma membrane order and fluidity are diversely triggered by elicitors of plant defence.J Exp Bot. 2016 Sep;67(17):5173-85. doi: 10.1093/jxb/erw284. Epub 2016 Jul 18. J Exp Bot. 2016. PMID: 27604805 Free PMC article.
-
Illuminating cellular architecture and dynamics with fluorescence polarization microscopy.J Cell Sci. 2024 Oct 15;137(20):jcs261947. doi: 10.1242/jcs.261947. Epub 2024 Oct 14. J Cell Sci. 2024. PMID: 39404619 Review.
-
Membrane fluidity and lipid order in ternary giant unilamellar vesicles using a new bodipy-cholesterol derivative.Biophys J. 2009 Apr 8;96(7):2696-708. doi: 10.1016/j.bpj.2008.12.3922. Biophys J. 2009. PMID: 19348752 Free PMC article.
-
Immunoglobulin E receptor signaling and asthma.J Biol Chem. 2011 Sep 23;286(38):32891-7. doi: 10.1074/jbc.R110.205104. Epub 2011 Jul 28. J Biol Chem. 2011. PMID: 21799019 Free PMC article. Review.
-
Fluorescence lifetime measurements and biological imaging.Chem Rev. 2010 May 12;110(5):2641-84. doi: 10.1021/cr900343z. Chem Rev. 2010. PMID: 20356094 Free PMC article. Review. No abstract available.
References
-
- Mukherjee, S., and F. R. Maxfield. 2004. Membrane domains. Annu. Rev. Cell Dev. Biol. 20:839–866. - PubMed
-
- Edidin, M. 2003. The state of lipid rafts: from model membranes to cells. Annu. Rev. Biophys. Biomol. Struct. 32:257–283. - PubMed
-
- Simons, K., and W. L. C. Vaz. 2004. Model systems, lipid rafts, and cell membranes. Annu. Rev. Biophys. Biomol. Struct. 33:269–295. - PubMed
MeSH terms
Substances
LinkOut - more resources
Full Text Sources
Medical
