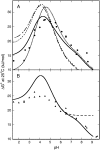
pK(a) values for side-chain carboxyl groups of a PGB1 variant explain salt and pH-dependent stability
- PMID: 17040982
- PMCID: PMC1697841
- DOI: 10.1529/biophysj.106.088682
pK(a) values for side-chain carboxyl groups of a PGB1 variant explain salt and pH-dependent stability
Erratum in
- Biophys J. 2009 May 6;96(9):3886
Abstract
Determination of pK(a) values of titrating residues in proteins provides a direct means of studying electrostatic coupling as well as pH-dependent stability. The B1 domain of protein G provides an excellent model system for such investigations. In this work, we analyze the observed pK(a) values of all carboxyl groups in a variant of PGB1 (T2Q, N8D, N37D) at low and high ionic strength as determined using (1)H-(13)C heteronuclear NMR in a structural context. The pK(a) values are used to calculate the pH-dependent stability in low and high salt and to investigate electrostatic coupling in the system. The observed pK(a) values can explain the pH dependence of protein stability but require pK(a) shifts relative to model values in the unfolded state, consistent with persistent residual structure in the denatured state. In particular, we find that most of the deviations from the expected random coil values can be explained by a significantly upshifted pK(a) value. We show also that (13)C backbone carbonyl data can be used to study electrostatic coupling in proteins and provide specific information on hydrogen bonding and electrostatic potential at nontitrating sites.
Figures


Similar articles
-
Carboxyl pK(a) values, ion pairs, hydrogen bonding, and the pH-dependence of folding the hyperthermophile proteins Sac7d and Sso7d.J Mol Biol. 2007 Sep 28;372(4):992-1008. doi: 10.1016/j.jmb.2007.06.089. Epub 2007 Jul 10. J Mol Biol. 2007. PMID: 17692336 Free PMC article.
-
pK(a) values for the unfolded state under native conditions explain the pH-dependent stability of PGB1.Biophys J. 2010 Nov 17;99(10):3365-73. doi: 10.1016/j.bpj.2010.08.078. Biophys J. 2010. PMID: 21081085 Free PMC article.
-
Salting the charged surface: pH and salt dependence of protein G B1 stability.Biophys J. 2006 Apr 15;90(8):2911-21. doi: 10.1529/biophysj.105.071050. Epub 2006 Jan 27. Biophys J. 2006. PMID: 16443658 Free PMC article.
-
Determination of pK(a) values of carboxyl groups in the N-terminal domain of rat CD2: anomalous pK(a) of a glutamate on the ligand-binding surface.Biochemistry. 2000 Jun 13;39(23):6814-24. doi: 10.1021/bi992209z. Biochemistry. 2000. PMID: 10841761
-
Protein ionizable groups: pK values and their contribution to protein stability and solubility.J Biol Chem. 2009 May 15;284(20):13285-9. doi: 10.1074/jbc.R800080200. Epub 2009 Jan 21. J Biol Chem. 2009. PMID: 19164280 Free PMC article. Review.
Cited by
-
Anomalous Salt Dependence Reveals an Interplay of Attractive and Repulsive Electrostatic Interactions in α-synuclein Fibril Formation.QRB Discov. 2020 Aug 6;1:e2. doi: 10.1017/qrd.2020.7. eCollection 2020. QRB Discov. 2020. PMID: 37528959 Free PMC article.
-
Proton Occupancies in Histidine Side Chains of Carbonic Anhydrase II by Neutron Crystallography and NMR - Differences, Similarities and Opportunities.Chembiochem. 2025 Feb 3;26(5):e202400930. doi: 10.1002/cbic.202400930. Epub 2025 Jan 2. Chembiochem. 2025. PMID: 39686888 Free PMC article.
-
Electrostatic Interactions in Protein Structure, Folding, Binding, and Condensation.Chem Rev. 2018 Feb 28;118(4):1691-1741. doi: 10.1021/acs.chemrev.7b00305. Epub 2018 Jan 10. Chem Rev. 2018. PMID: 29319301 Free PMC article. Review.
-
Forced gating motions by a substituted titratable side chain at the bundle crossing of a potassium channel.J Biol Chem. 2011 Oct 21;286(42):36686-93. doi: 10.1074/jbc.M111.249110. Epub 2011 Aug 30. J Biol Chem. 2011. PMID: 21878633 Free PMC article.
-
Single molecule force spectroscopy reveals that electrostatic interactions affect the mechanical stability of proteins.Biophys J. 2011 Mar 16;100(6):1534-41. doi: 10.1016/j.bpj.2011.01.062. Biophys J. 2011. PMID: 21402036 Free PMC article.
References
-
- Alexander, P., S. Fahnestock, T. Lee, J. Orban, and P. Bryan. 1992. Thermodynamic analysis of the folding of the streptococcal protein G IgG-binding domains B1 and B2: why small proteins tend to have high denaturation temperatures. Biochemistry. 31:3597–3603. - PubMed
-
- Smith, C. K., J. M. Withka, and L. Regan. 1994. A thermodynamic scale for the beta-sheet forming tendencies of the amino acids. Biochemistry. 33:5510–5517. - PubMed
-
- Khare, D., P. Alexander, J. Antosiewicz, P. Bryan, M. Gilson, and J. Orban. 1997. pKa measurements from nuclear magnetic resonance for the B1 and B2 immunoglobulin G-binding domains of protein G: comparison with calculated values for nuclear magnetic resonance and X-ray structures. Biochemistry. 36:3580–3589. - PubMed
Publication types
MeSH terms
Substances
LinkOut - more resources
Full Text Sources

