. 2007 Jan 1;92(1):3-9.
doi: 10.1529/biophysj.106.091157. Epub 2006 Oct 13.

Enhanced surfactant adsorption via polymer depletion forces: a simple model for reversing surfactant inhibition in acute respiratory distress syndrome

Affiliations

Enhanced surfactant adsorption via polymer depletion forces: a simple model for reversing surfactant inhibition in acute respiratory distress syndrome

Patrick C Stenger et al. Biophys J. .

Abstract

Lung surfactant adsorption to an air-water interface is strongly inhibited by an energy barrier imposed by the competitive adsorption of albumin and other surface-active serum proteins that are present in the lung during acute respiratory distress syndrome. This reduction in surfactant adsorption results in an increased surface tension in the lung and an increase in the work of breathing. The reduction in surfactant adsorption is quantitatively described using a variation of the classical Smolukowski analysis of colloid stability. Albumin adsorbed to the interface induces an energy barrier to surfactant diffusion of order 5 k(B)T, leading to a reduction in adsorption equivalent to reducing the surfactant concentration by a factor of 100. Adding hydrophilic, nonadsorbing polymers such as polyethylene glycol to the subphase provides a depletion attraction between the surfactant aggregates and the interface that eliminates the energy barrier. Surfactant adsorption increases exponentially with polymer concentration as predicted by the simple Asakura and Oosawa model of depletion attraction. Depletion forces can likely be used to overcome barriers to adsorption at a variety of liquid-vapor and solid-liquid interfaces.


Figures

FIGURE 1
FIGURE 1
Cyclic isotherms of Survanta on various subphases. (a) 800 μg Survanta on a clean buffered saline subphase. On compression, the surface pressure increases until the isotherm has a characteristic shoulder at 40 mN/m. This corresponds to rearrangement of the unsaturated lipids and surfactant proteins SP-B and SP-C in the film (38). On further compression, the surface pressure rises abruptly to the collapse pressure of 65 mN/m. At this surface pressure, the film begins to “collapse” and forms cracks and folds as seen in Fig. 2 b. Film collapse determines the minimum surface tension possible for a given surfactant. On expansion, the surface pressure drops to 10 mN/m; lung surfactant isotherms exhibit significant hysteresis between the compression and expansion parts of the cycle. The cracks and folds in the monolayer begin to unfold and heal at these low surface pressures on expansion, which accounts for much of the hysteresis (17). (b) 800 μg Survanta on saline buffer containing 2 mg/mL albumin. The characteristic shoulder and collapse plateau on compression seen in panel a cannot be reached with albumin in the subphase, and the surface pressure does not rise to 40 mN/m. Albumin concentrations in ARDS alveolar fluid may reach 100 mg/ml, with an average concentration of 25 mg/ml (35); the concentrations used here are significantly lower than typically found in ARDS patients. The albumin prevents surfactant from reaching the interface and spreading as shown in Fig. 2, c and d. (c) Increasing the Survanta concentration to 3800 μg on saline buffer containing 2 mg/mL albumin does not restore the isotherm in panel a, and although the surface pressure does rise sufficiently that the shoulder at 40 mN/m is visible, the collapse plateau is not reached. Less surfactant adsorbs to the interface that for a clean interface, even though the total surfactant concentration has increased. (d) 800 μg Survanta on saline buffer containing 2 mg/mL albumin and 1.2 wt % polyethylene glycol (PEG) polymer of 10 K molecular weight. The characteristic shoulder and collapse plateau of panel a have been restored with little change in surface pressure showing that the PEG reverses the albumin inhibition. The only difference with the isotherm in panel a is that the minimum surface pressure is ∼20 mN/m with PEG in the subphase (18). This suggests that the PEG also helps the collapsed monolayer to heal at higher surface pressures, along with increasing surfactant adsorption to the interface.
FIGURE 2
FIGURE 2
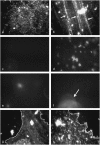
Fluorescence images of 800 μg Survanta spread at varying subphase compositions. Images are 180 μm by 250 μm. The left column is for each subphase composition at Π = 18 mN/m (a, c, e, g) and the right column is for each subphase at the maximum surface pressure reached during the cycle (66, , , and 38 mN/m, respectively for b, d, f, and h). (Row 1) Survanta on a clean, buffered subphase. (a) Mottled texture typical of a phase-separated lipid/protein monolayer. The mottled texture is found at all surface pressures from 0 to collapse. (b) Arrows denote cracks where material is forced from the interface at the collapse plateau at 66 mN/m. (Row 2) Survanta on buffer containing 2 mg/mL albumin. (c) At low surface pressure, no fluorescence is visible showing that the albumin prevents Survanta from adsorbing to the interface. (d) After several expansion and compression cycles (see Fig. 1 b), Survanta comes close to the interface, but does not spread due to the albumin film at the interface (compare to eh). (Row 3) (e) During the first cycle for Survanta spread on buffer containing 2 mg/mL albumin and 0.12 wt % PEG, small areas of the interface are starting to become covered with Survanta. (f) The Survanta monolayer begins to displace the albumin (arrow). (Row 4) (g) By the third expansion-compression cycle for Survanta spread on buffer containing 2 mg/mL albumin and 0.12 wt % PEG, larger areas have a morphology similar to Survanta on a clean interface (Row 1, a and b) in coexistence with areas similar to albumin (Row 2, c and d). The dotted white lines denote the borders between the two regions. 0.12 wt % PEG is not sufficient to allow for sufficient Survanta adsorption to completely displace the albumin (See Fig. 3). For ∼1 wt % PEG, the images are identical to Row 1 for all cycles (not shown).
FIGURE 3
FIGURE 3
Fourth compression cycle isotherms of increasing concentrations of Survanta on a clean buffer subphase (a) and 800 μg Survanta on subphases containing 2 mg/ml albumin with increasing PEG concentrations (b). (a) Up-triangle, 8 μg Survanta; pentagram, 30 μg Survanta; diamond, 80 μg Survanta; circle, 300 μg Survanta; and square, 800 μg Survanta. At a given surface pressure, the isotherms are translated essentially unchanged from low trough area to high trough area with increasing Survanta concentration (note the characteristic shoulder at ∼40 mN/m and the collapse plateau at ∼65 mN/m). This shows that Survanta adsorption increases with increasing concentration as suggested by Eq. 1. The interface becomes saturated for concentrations >∼300 μg; the 800 μg isotherm is not displaced significantly to higher trough areas. (b) square, Survanta on saline buffer subphase with no albumin; circle, Survanta-albumin; diamond, Survanta-albumin 0.25 wt % PEG; pentagram, Survanta-albumin 0.50 wt % PEG; and up-triangle, Survanta-albumin 1.2 wt % PEG. The red curve shows the surface pressure for the albumin subphase with no Survanta or PEG. Comparing to panel a shows that albumin in the subphase produces the same effect as decreasing the Survanta concentration from 800 μg to ∼8 μg. Adding increasing amounts of PEG to the subphase shifts the isotherms to higher trough areas, the same effect as increasing the Survanta concentration in panel a. The shaded area denotes the trough area over which the surface pressure was averaged for each PEG concentration to obtain the relative surfactant adsorption plotted in Fig. 4.
FIGURE 4
FIGURE 4
The relative adsorption (RA) is the difference between the sample surface pressure (Π) and the surface pressure of the albumin-only isotherm (ΠAlb, red curve in Fig. 3 b), divided by the difference between the surface pressure for the saturated isotherm (>1% PEG in Fig. 3 b) and ΠAlb, formula image. All surface pressures were evaluated by averaging over the same trough area denoted by the shaded area in Fig. 3 b. The solid line is a good fit to the data showing the exponential dependence of RA on the polymer concentration as predicted by Eqs. 1–3, consistent with the depletion attraction lowering the energy barrier to surfactant adsorption.

References

    1. Clements, J. A., and M. E. Avery. 1998. Lung surfactant and neonatal respiratory distress syndrome. Am. J. Respir. Crit. Care Med. 157:59–66. - PubMed
    1. Notter, R. H. 2000. Lung Surfactant: Basic Science and Clinical Applications. Marcel Dekker, New York.
    1. Lipp, M. M., K. Y. C. Lee, J. A. Zasadzinski, and A. J. Waring. 1996. Phase and morphology changes in lipid monolayers induced by SP-B protein and its amino-terminal peptide. Science. 273:1196–1199. - PubMed
    1. Haitsma, J. J., P. J. Papadakos, and B. Lachmann. 2004. Surfactant therapy for acute lung injury/acute respiratory distress syndrome. Curr. Opin. Crit. Care. 10:18–22. - PubMed
    1. Avery, M. E. 2000. Surfactant deficiency in hyaline membrane disease. Am. J. Respir. Crit. Care Med. 161:1074–1075. - PubMed

Publication types

LinkOut - more resources