. 2006 Dec;142(4):1460-8.
doi: 10.1104/pp.106.087882. Epub 2006 Oct 13.

NAD(P)H oscillates in pollen tubes and is correlated with tip growth

Affiliations

NAD(P)H oscillates in pollen tubes and is correlated with tip growth

Luis Cárdenas et al. Plant Physiol. 2006 Dec.

Abstract

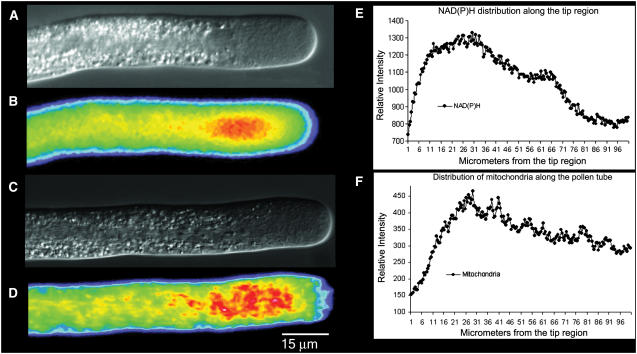
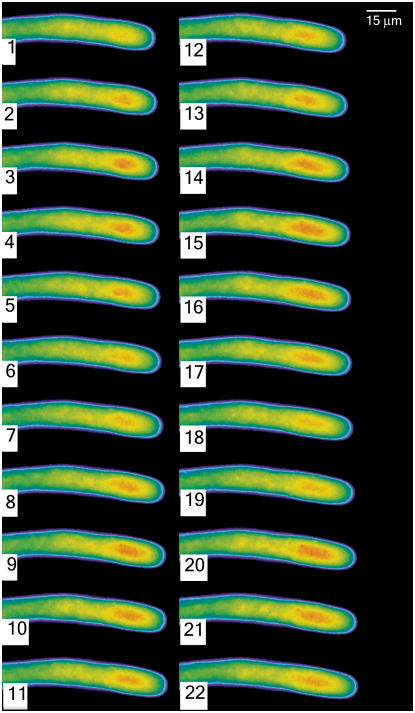
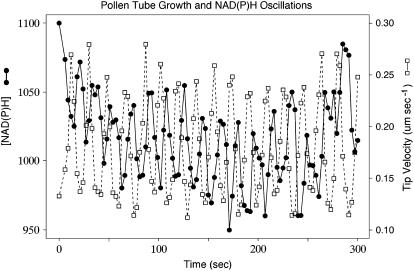
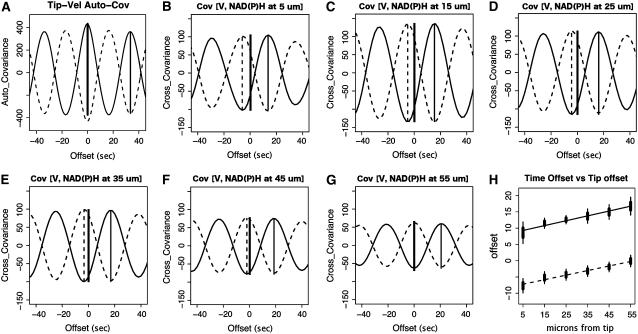
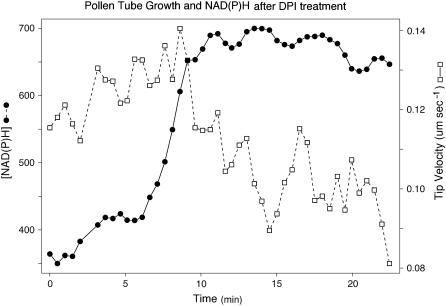
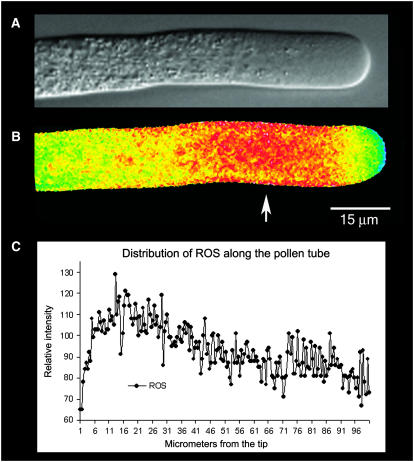
The location and changes in NAD(P)H have been monitored during oscillatory growth in pollen tubes of lily (Lilium formosanum) using the endogenous fluorescence of the reduced coenzyme (excitation, 360 nm; emission, >400 nm). The strongest signal resides 20 to 40 microm behind the apex where mitochondria (stained with Mitotracker Green) accumulate. Measurements at 3-s intervals reveal that NAD(P)H-dependent fluorescence oscillates during oscillatory growth. Cross-correlation analysis indicates that the peaks follow growth maxima by 7 to 11 s or 77 degrees to 116 degrees, whereas the troughs anticipate growth maxima by 5 to 10 s or 54 degrees to 107 degrees. We have focused on the troughs because they anticipate growth and are as strongly correlated with growth as the peaks. Analysis of the signal in 10-microm increments along the length of the tube indicates that the troughs are most advanced in the extreme apex. However, this signal moves basipetally as a wave, being in phase with growth rate oscillations at 50 to 60 microm from the apex. We suggest that the changes in fluorescence are due to an oscillation between the reduced (peaks) and oxidized (troughs) states of the coenzyme and that an increase in the oxidized state [NAD(P)(+)] may be coupled to the synthesis of ATP. We also show that diphenyleneiodonium, an inhibitor of NAD(P)H dehydrogenases, causes an increase in fluorescence and a decrease in tube growth. Finally, staining with 5-(and-6)-chloromethyl-2',7'-dichlorohydrofluorescein acetate indicates that reactive oxygen species are most abundant in the region where mitochondria accumulate and where NAD(P)H fluorescence is maximal.


Figures

Figure 1.
Figure 1.
A and B, From the same pollen tube, the cell structure by DIC (A) and the distribution of NAD(P)H determined by its autofluorescence (B). Note the strongest signal at a region 20 to 40 μm back from the apex. C and D, From another pollen tube, the DIC (C) image and the corresponding fluorescent image (D) revealing the distribution of mitochondria when stained with Mitotracker Green. Note the accumulation of mitochondria in the subapical region, 20 to 40 μm back from the apex. In both B and D, the color follows convention, with red indicating high and blue indicating low levels of fluorescent signal. In E and F, a line scan along the length of the pollen tubes shown in B and D plots the distribution of NAD(P)H and mitochondria, respectively. Again, note the higher signal in the subapical region.
Figure 2.
Figure 2.
A time lapse sequence of a growing pollen tube reveals the changes in NAD(P)H fluorescence as the pollen tube grows. The individual images were acquired by exposure for 250 ms, with a 3-s interval between successive images. They are displayed in pseudocolor where red indicates high levels of NAD(P)H.
Figure 3.
Figure 3.
A comparison of the growth rate (dashed line; white squares), and NAD(P)H fluorescence, taken at about 20 μm behind the tip (solid line; black circles), reveals that these two oscillatory signals show the same period but not the same phase.
Figure 4.
Figure 4.
Cross-correlation analysis of tip growth with NAD(P)H fluorescence in incremental regions (10 μm) along the length of the pollen tube. A to G, Analysis of one pollen tube in a series of six. A, Autocorrelation of tip growth. The thick vertical bars represent 95% confidence intervals of the mean phase offset, while the thin vertical extensions mark 95% confidence intervals of the offsets. B to G, Cross covariance between tip growth and NAD(P)H fluorescence in circumscribed regions centered at 5, 15, 25, 35, 45, and 55 μm behind the tip. The thick vertical solid line illustrates the position of zero offset. The displacement of the positive correlation peak is marked by a thin solid line and the displacement of the negative correlation is marked by a dashed vertical line. H, Average phase offset of NAD(P)H positive (solid line) and negative correlation (dashed line) of fluorescence to tip growth for the series of six tubes. The vertical bars represent a 95% confidence intervals of the mean phase offset.
Figure 5.
Figure 5.
Treatment of a pollen tube with DPI after 5 min of exposure causes a reduction in the growth rate (dashed line; white squares) and a concomitant increase in NAD(P)H autofluorescence (solid line; black circles).
Figure 6.
Figure 6.
A and B show the same pollen tube. A, DIC image; B, fluorescence image indicating the relative distribution of ROS. To make this image, the pollen tube was microinjected with CM-H2DCFDA, which is sensitive to ROS, and tetramethyl-rhodamine 70 kD, which is an accessible volume marker. A ratio-image of the two fluorophores provides an indication of the distribution of ROS, which is independent of the optical path length. Note the highest values in the subapical region where mitochondria are more abundant (Fig. 1D). Figure 6C provides a line scan of intensity values along the length of the pollen tube shown in B. Note the increase in signal in the subapical region (see arrow).

References

    1. Baker CJ, Deahl K, Domek J, Orlandi EW (1998) Oxygen metabolism in plant/bacteria interactions: effect of DPI on the pseudo-NAD(P)H oxidase activity of peroxidase. Biochem Biophys Res Commun 252: 461–464 - PubMed
    1. Blanchoin L, Pollard TD (1999) Mechanism of interaction of Acanthamoeba actophorin (ADF/Cofilin) with actin filaments. J Biol Chem 274: 15538–15546 - PubMed
    1. Blinova K, Carroll S, Bose S, Smirnov AV, Harvey JJ, Knutson JR, Balaban RS (2005) Distribution of mitochondrial NADH fluorescence lifetimes: steady-state kinetics of matrix NADH interactions. Biochemistry 44: 2585–2594 - PubMed
    1. Brachmanski M, Gebhard MM, Nobiling R (2004) Separation of fluorescence signals from Ca2+ and NADH during cardioplegic arrest and cardiac ischemia. Cell Calcium 35: 381–391 - PubMed
    1. Brillinger DR (1975) Time Series: Data Analysis and Theory. Holt-Rinehart, New York

Publication types