. 2006 Dec;142(4):1759-70.
doi: 10.1104/pp.106.084400. Epub 2006 Oct 13.

Nuclear magnetic resonance spectroscopy-based metabolite profiling of transgenic tomato fruit engineered to accumulate spermidine and spermine reveals enhanced anabolic and nitrogen-carbon interactions

Affiliations

Nuclear magnetic resonance spectroscopy-based metabolite profiling of transgenic tomato fruit engineered to accumulate spermidine and spermine reveals enhanced anabolic and nitrogen-carbon interactions

Autar K Mattoo et al. Plant Physiol. 2006 Dec.

Abstract

Polyamines are ubiquitous aliphatic amines that have been implicated in myriad processes, but their precise biochemical roles are not fully understood. We have carried out metabolite profiling analyses of transgenic tomato (Solanum lycopersicum) fruit engineered to accumulate the higher polyamines spermidine (Spd) and spermine (Spm) to bring an insight into the metabolic processes that Spd/Spm regulate in plants. NMR spectroscopic analysis revealed distinct metabolite trends in the transgenic and wild-type/azygous fruits ripened off the vine. Distinct metabolites (glutamine, asparagine, choline, citrate, fumarate, malate, and an unidentified compound A) accumulated in the red transgenic fruit, while the levels of valine, aspartic acid, sucrose, and glucose were significantly lower as compared to the control (wild-type and azygous) red fruit. The levels of isoleucine, glucose, gamma-aminobutyrate, phenylalanine, and fructose remained similar in the nontransgenic and transgenic fruits. Statistical treatment of the metabolite variables distinguished the control fruits from the transgenic fruit and provided credence to the pronounced, differential metabolite profiles seen during ripening of the transgenic fruits. The pathways involved in the nitrogen sensing/signaling and carbon metabolism seem preferentially activated in the high Spd/Spm transgenics. The metabolite profiling analysis suggests that Spd and Spm are perceived as nitrogenous metabolites by the fruit cells, which in turn results in the stimulation of carbon sequestration. This is seen manifested in higher respiratory activity and up-regulation of phosphoenolpyruvate carboxylase and NADP-dependent isocitrate dehydrogenase transcripts in the transgenic fruit compared to controls, indicating high metabolic status of the transgenics even late in fruit ripening.


Figures

Figure 1.
Figure 1.
A typical 600-MHz 1H NMR spectrum of tomato fruit powder in D2O buffer solution and resonance for some of the indicated metabolites.
Figure 2.
Figure 2.
Profiles of amino acids and GABA in wild-type (WT), azygous (556AZ), and two homozygous, transgenic (556HO, 579HO) tomato fruits at four stages of ripening. Shown is relative molecular abundance based on intensities of 1H NMR signals from indicated metabolites in tomato fruit at four different stages of ripeness (MG, mature green; BR, breaker; PK, pink; RD, red). Data given are means ± SEM. ** and ***, Significant differences, respectively, at P values <0.05 and <0.005 in the levels of indicated metabolite between the transgenic fruits and the controls (WT and 556AZ). See also Supplemental Table S1.
Figure 3.
Figure 3.
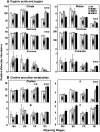
Profiles of organic acids and sugars (A) and choline and other metabolites (B) in wild-type (WT), azygous (556AZ), and two homozygous, transgenic (556HO, 579HO) tomato fruits at four stages of ripening (MG, mature green; BR, breaker; PK, pink; RD, red). The P values of significant differences between the transgenics versus nontransgenic controls were as follows: 0.0001 for citrate (***), 0.001 for malate (***), 0.00001 for fumarate (***), 0.015 at PK (**) and 0.002 at RD (***) for choline, and 0.00001 for compound A (***). All other details are the same as given in the Figure 2 legend. See also Supplemental Table S1.
Figure 4.
Figure 4.
A typical representation of ratios. A and B, Fru (fruc) to Glc (gluc; A) and acid to sugar (B) in transgenic (556HO and 579HO) fruits compared to azygous (556AZ) control fruit. The ratio of acid to sugar (B) is given as the sum of citrate (citr) and malate to that of Glc plus Fru plus Suc. These results were generated from the data given in Figure 2. Azygous556 (white bars), 556HO (gray bars), and 579HO (black bars) fruits at mature green (MG), breaker (BR), pink (PK), and red (RD) stages of ripening are represented. Data given are means + SEM. The P values of significant differences between the transgenic versus azygous control are indicated for the red fruits.
Figure 5.
Figure 5.
A, LDA of 16 tomato fruit samples. Symbols: •, mature green and breaker tomatoes; □, pink; ▴, red tomatoes. B, PCA map of 16 tomato fruit samples. Symbols: ⋄, mature green wild type and 556AZ; ♦, mature green 556HO and 579HO; ▿, breaker wild type and 556AZ; ▾, breaker 556HO and 579HO; □, pink wild type and 556AZ; ▪, pink 556HO and 579HO; ▵, red wild type and 556AZ; ▴, red 556HO and 579HO. The following variables were included in the analysis: Glu, Val, compound A, Glc, Asp, compound C, citrate, Asn, GABA, Ala, Phe, Thr, and Suc. ANOVA analysis is provided in Table II.
Figure 6.
Figure 6.
Rates of respiration in azygous and two transgenic fruits. CO2 evolution from nontransgenic azygous (556AZ, ♦) and transgenic tomato fruit (556HO, ▪; 579HO, ▴) during ripening was measured in a flow-through system by gas chromatography. Ripening stages were recorded based on color development. Data are represented as means ± SEM; n = 8.
Figure 7.
Figure 7.
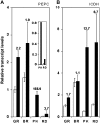
Real-time PCR analysis of LePEPC2 (A) and LeICDH (B) transcript levels. The levels of PEPC2 and ICDHc transcripts were determined relative to the calibrator azygous (556AZ, □) at green (GR) stage. The ratio of transcript levels in transgenic fruit (556HO, black bars) to those in the azygous, control fruit (556AZ, white bars) at different stages (GR, BR, PK, and RD) of ripening is indicated on top of the black bars. The range in variation is shown as error bars, which was determined by evaluating the expression 2T−ΔΔC with ΔΔCT + s and ΔΔCTs, where s is the sd of the ΔΔCT value (n = 3). The inset in A shows an enlarged view of the PEPC transcript levels at PK and RD stages of 556AZ (white bars) and 556HO (black bars) fruit.
Figure 8.
Figure 8.
An illustration of metabolic pathways for the biosynthesis of the identified metabolites pinpointing linkages between N and C metabolism in the transgenic tomato fruits. White arrows represent high (single arrow straight up), higher (double arrows straight up), lower (downward single arrow), or no change (parallel) in the indicated metabolite levels in the transgenic, higher polyamines accumulating red fruit compared to wild-type/azygous fruit. Phenylalanine level showed a downward. Light-dark, striped arrows indicate metabolites Spd, Spm, and ethylene, which were higher, and putrescine, which was lower, in the transgenics than the controls (from Mehta et al., 2002). Dark arrows (next to PEPC and ICDH) indicate the sites of the reaction of the corresponding transcripts of PEPC and ICDHc whose levels were higher in the transgenic fruit than the control fruit.

References

    1. Abeles FB, Morgan PW, Saltveit ME Jr (1992) Ethylene in Plant Biology. Academic Press, New York
    1. Alba R, Payton P, Fei Z, McQuinn R, Debbie P, Martin GB, Tanksley SD, Giovannonin JJ (2005) Transcriptome and selected metabolite analyses reveal multiple points of ethylene control during tomato fruit development. Plant Cell 17: 2954–2965 - PMC - PubMed
    1. Amato ME, Ansanelli G, Fisichella S, Lamanna R, Scarlata G, Sobolev AP, Segre AL (2004) Wheat flour enzymatic amylolysis monitored by in situ 1H-NMR spectroscopy. J Agric Food Chem 52: 823–831 - PubMed
    1. Bauer GA, Bazzaz FA, Minocha R, Long S, Magill A, Aber J, Berntson GM (2004) Effects of chronic N additions on tissue chemistry, photosynthetic capacity, and carbon sequestration potential of a red pine (Pinus resinosa Ait.) stand in NE United States. For Ecol Manage 196: 173–186
    1. Biale JB, Young RE (1981) Respiration and ripening in fruits: retrospect and prospect. In J Friend, MJC Rhodes, eds, Recent Advances in the Biochemistry of Fruits and Vegetables. Academic Press, New York, pp 103–109

Publication types

MeSH terms

LinkOut - more resources