. 2006 Dec;5(12):2147-60.
doi: 10.1128/EC.00270-06. Epub 2006 Oct 13.

Pheromone-induced degradation of Ste12 contributes to signal attenuation and the specificity of developmental fate

Affiliations

Pheromone-induced degradation of Ste12 contributes to signal attenuation and the specificity of developmental fate

R Keith Esch et al. Eukaryot Cell. 2006 Dec.

Abstract

The Ste12 transcription factor of Saccharomyces cerevisiae regulates transcription programs controlling two different developmental fates. One is differentiation into a mating-competent form that occurs in response to mating pheromone. The other is the transition to a filamentous-growth form that occurs in response to nutrient deprivation. These two distinct roles for Ste12 make it a focus for studies into regulatory mechanisms that impart biological specificity. The transient signal characteristic of mating differentiation led us to test the hypothesis that regulation of Ste12 turnover might contribute to attenuation of the mating-specific transcription program and restrict activation of the filamentation program. We show that prolonged pheromone induction leads to ubiquitin-mediated destabilization and decreased amounts of Ste12. This depletion in pheromone-stimulated cultures is dependent on the mating-pathway-dedicated mitogen-activated protein kinase Fus3 and its target Cdc28 inhibitor, Far1. Attenuation of pheromone-induced mating-specific gene transcription (FUS1) temporally correlates with Ste12 depletion. This attenuation is abrogated in the deletion backgrounds (fus3Delta or far1Delta) where Ste12 is found to persist. Additionally, pheromone induces haploid invasion and filamentous-like growth instead of mating differentiation when Ste12 levels remain high. These observations indicate that loss of Ste12 reinforces the adaptive response to pheromone and contributes to the curtailing of a filamentation response.


Figures
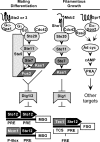
FIG. 1.
FIG. 1.
Signal transduction pathways with common components mediate two life cycle transitions in haploid S. cerevisiae. See the text for an explanation.
FIG. 2.
FIG. 2.
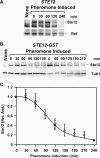
The steady-state amount of Ste12 decreases during pheromone induction. (A) A representative immunoblot showing amounts of Ste12 at different times during pheromone induction of strain E929-6C (STE12). The signal from a nonspecific cross-reacting protein (Ref) serves as an internal reference for loading and blotting. (B) Representative immunoblots showing amounts of Ste12-GST at different times during pheromone induction of strain E929-6C-92 (STE12-GST). Tubulin (Tub1) serves as an internal reference for loading and blotting. The first lanes (None) in panels A and B show an extract from an isogenic ste12Δ strain (E929-6C-6) as a negative control. (C) Plots comparing the relative amounts of Ste12 versus time from STE12 (▴) and STE12-GST (▵) strains undergoing pheromone induction. The amount of Ste12 at each time point is the Ste12 or Ste12-GST signal intensity divided by the signal intensity for the corresponding internal reference. Relative amounts are normalized to the amount of Ste12 or Ste12-GST at time zero for each time course. Values are averages from three or more independent experiments. Bars show the average deviation for each point.
FIG. 3.
FIG. 3.
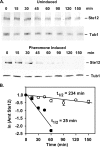
Comparison of Ste12 half-lives under uninduced and pheromone-induced conditions. (A) Representative immunoblots showing amounts of Ste12-GST and Tub1 in extracts prepared from a STE12-GST strain (E929-6C-92) at different times after the addition of cycloheximide (20 μM) to cultures without and with pheromone. Tub1 serves as an internal reference to highlight the differences in Ste12-GST stability under the two conditions. (B) Plots comparing the natural log of the amount of Ste12-GST versus time. The amount of Ste12-GST at each time point is the signal intensity for Ste12-GST relative to the amount at time zero for each time course. Values for Ste12-GST from uninduced cultures (○) are averages of two independent experiments, and those for the pheromone-induced cultures (•) are averages of four independent experiments.
FIG. 4.
FIG. 4.
Covalent ubiquitin-Ste12 conjugates are intermediates in proteasome degradation of Ste12. Cultures of STE12 8His-UBI erg6Δ (YW002 pYES-8HisUbi), 18myc-STE12 His8-UBI erg6Δ (YW001 pYES-8HisUbi), and 18-myc-STE12 erg6Δ (YW001 vector) strains were treated with the proteasome inhibitor MG132 (50 μM) for 90 min prior to the addition of pheromone (3 μM α-factor) for induction (+) or continued incubation without pheromone for the uninduced reference (−), as indicated. Immunoblots compare the amounts of 18-myc-Ste12 in samples from the different cultures by using anti-myc antibodies (lanes 1 to 5). Proteins covalently conjugated to 8His-ubiquitin from the indicated samples were isolated by metal affinity purification and analyzed on duplicate immunoblots. 18-myc-Ste12 conjugated to 8His-Ubi was detected on one blot by using anti-myc antibodies (lanes 6 to 10), and the total cellular population of 8His-Ubi-conjugated proteins was detected on the other by using anti-ubiquitin antibodies (lanes 11 to 15).
FIG. 5.
FIG. 5.
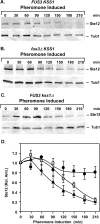
The MAPK Fus3 is required for pheromone-induced degradation of Ste12. (A to C) Representative immunoblots showing the amount of Ste12-GST from extracts of STE12-GST FUS3 KSS1 (E929-6C-92), STE12-GST fus3Δ KSS1 (E929-6C-95), and STE12-GST FUS3 kss1Δ (E929-6C-97) strains at different times after the addition of pheromone to cultures. Tubulin (Tub1) serves as an internal reference for loading and blotting. (D) Plots comparing the relative amounts of Ste12-GST versus time from FUS3 KSS1 (triangles), fus3Δ KSS1 (circles), and FUS3 kss1Δ (squares) strains undergoing pheromone induction. Relative amounts of Ste12-GST at each time point are as specified in Fig. 2. Values are averages from three independent experiments. Bars show the average deviations.
FIG. 6.
FIG. 6.
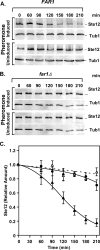
Far1 is required for pheromone-induced degradation of Ste12. (A and B) Representative immunoblots comparing amounts of Ste12-GST from extracts of STE12-GST FAR1 (E929-6C-92) and STE12-GST far1Δ (E929-6C-96) strains cultured at 30°C either under pheromone-induced or uninduced conditions. Tubulin (Tub1) serves as an internal reference for loading and blotting. (C) Plots comparing the relative amounts of Ste12-GST versus time from the FAR1 strain with (▴) and without (▵) pheromone induction and the far1Δ strain (•) with pheromone induction. Relative amounts of Ste12-GST at each time point are as specified in Fig. 2. Values are averages from three independent experiments. Bars show the average deviations.
FIG. 7.
FIG. 7.
G1 arrest is not sufficient for promoting degradation of Ste12. (A and B) Representative immunoblots comparing amounts of Ste12-GST from extracts of STE12-GST CDC28 (BB151) and STE12-GST cdc28-13 (BB153) strains cultured at 37°C either under pheromone-induced or uninduced conditions. Tubulin (Tub1) serves as an internal reference for loading and blotting. (C and D) Plots comparing the relative amounts of Ste12-GST versus time from the CDC28 strain with (▴) or without (▵) pheromone induction and from the cdc28 temperature-sensitive (cdc28ts) strain with (•) or without (○) pheromone induction. Relative amounts of Ste12-GST at each time point are as specified in Fig. 2. Values are averages from three independent experiments. Bars show the average deviations.
FIG. 8.
FIG. 8.
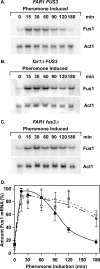
Induction profiles for FUS1 mRNA correlate with Ste12 abundance. (A to C) Representative Northern blots comparing the amounts of FUS1 mRNA from FAR1 FUS3 (E929-6C-92), far1Δ FUS3 (E929-6C-96), and FAR1 fus3Δ (E929-6C-95) strains at different times after the addition of pheromone (3 μM) to cultures. Actin mRNA (ACT1) serves as an internal reference for loading and blotting. (D) Plots showing the relative amounts of FUS1 mRNA versus time for FAR1 FUS3 (circles), far1Δ FUS3 (squares), and FAR1 fus3Δ (triangles) backgrounds. The amount of FUS1 mRNA at each time point is the FUS1 signal intensity divided by the signal intensity for the ACT1 internal reference. Relative amounts are normalized to the maximum amount for each separate time course. Values are averages from three or more independent experiments. (Note that the averages may not show a 100% value, because the maximum in some trials occurred at 15 min but in others at 30 min.) Bars show the average deviation for each point.
FIG. 9.
FIG. 9.
Pheromone-induced haploid invasion assays. Lawns of 105 cells from wild-type (Wt) (E929-6C-92), fus3Δ (E929-6C-95), far1Δ (E929-6C-96), and ste12Δ (E929-6C-6) strains were spread onto YPD plates either in the presence (+) or absence (−) of mating pheromone (20 μg α-factor) applied to a disc at the center of the lawn. Plates were incubated for 48 h at 30°C. Photographs show plates before and after washing of cells from the agar surface. Prewash plates show the extent of pheromone-induced G1 arrest apparent as a zone of growth inhibition (halo). Postwash plates show cells that invaded the agar substrate.
FIG. 10.
FIG. 10.
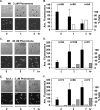
Ste12 depletion or persistence correlates with different pheromone-induced developmental fates. (A, C, and E) DIC and corresponding fluorescence images of STE12-GFP FUS3 (Wt) (E929-6C-94) or STE12-GFP fus3Δ (E929-6C-106) cells on medium containing the indicated amounts of mating pheromone α-factor. The micrographs are a collage of cells from one or more fields that have been arranged to eliminate empty regions and minimize the size of the figure. Images are from fields captured immediately upon placing cells on α-factor medium (0 h) and from different fields at the indicated times after slide preparation. Cells showing shmoo (S) or filamentous (F) morphologies are indicated. (B, D, and F) Bars show the percentages of cells scored as having shmoo (open bares) or filamentous (gray bars) morphologies and the average Ste12-GFP fluorescence signal (black bars) at the indicated times. The number of cells scored for morphology and quantified for Ste12-GFP fluorescence at each time interval is specified above the bars.

Similar articles

Cited by

References

    1. Bao, M. Z., M. A. Schwartz, G. T. Cantin, J. R. Yates III, and H. D. Madhani. 2004. Pheromone-dependent destruction of the Tec1 transcription factor is required for MAP kinase signaling specificity in yeast. Cell 119:991-1000. - PubMed
    1. Bardwell, L., J. G. Cook, V. Depak, D. M. Baggott, A. R. Martinez, and J. Thorner. 1998. Repression of yeast Ste12 transcription factor by direct binding of unphosphorylated Kss1 MAPK and its regulation by the Ste7 MEK. Genes Dev. 12:2887-2898. - PMC - PubMed
    1. Bardwell, L., J. G. Cook, J. X. Zhu-Shimoni, D. Voora, and J. Thorner. 1998. Differential regulation of transcription: repression by unactivated mitogen-activated protein kinase Kss1 requires the Dig1 and Dig2 proteins. Proc. Natl. Acad. Sci. USA 95:15400-15405. - PMC - PubMed
    1. Baur, M., R. K. Esch, and B. Errede. 1997. Cooperative binding interactions required for function of the Ty1 sterile responsive element. Mol. Cell. Biol. 17:4330-4337. - PMC - PubMed
    1. Breitkreutz, A. 2002. Signal specificity in the budding yeast mating/filamentous MAPK pathway. University of Toronto, Toronto, Canada.

Publication types

MeSH terms

LinkOut - more resources