. 2006 Nov;12(11):1301-9.
doi: 10.1038/nm1492. Epub 2006 Oct 15.

Interleukin-10 determines viral clearance or persistence in vivo

Affiliations

Interleukin-10 determines viral clearance or persistence in vivo

David G Brooks et al. Nat Med. 2006 Nov.

Abstract

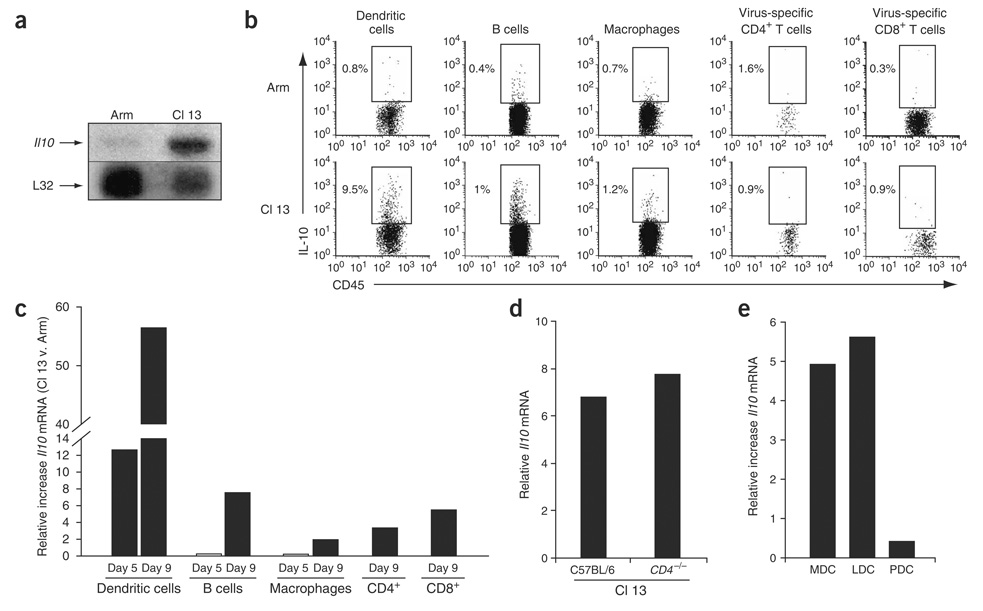
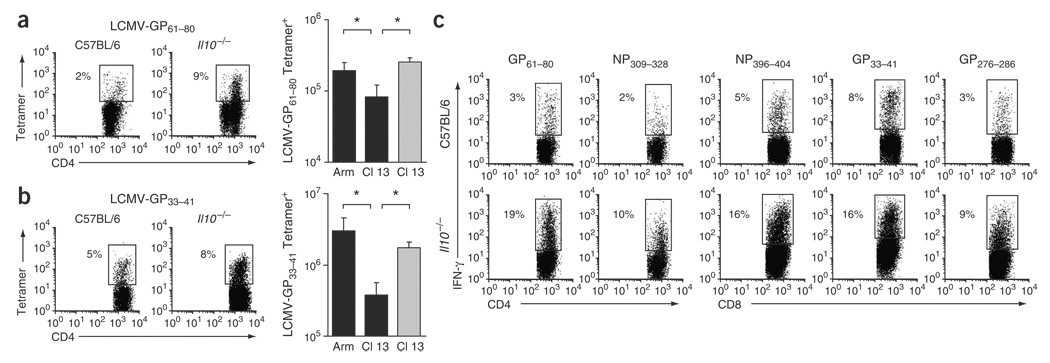
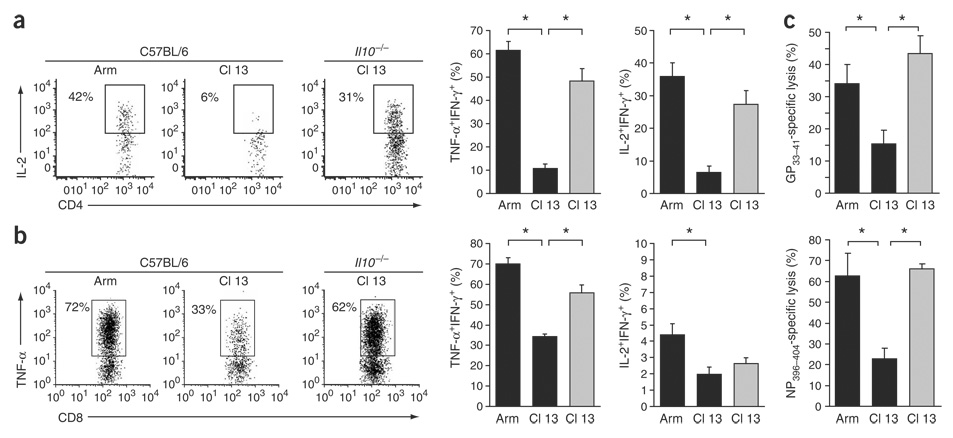
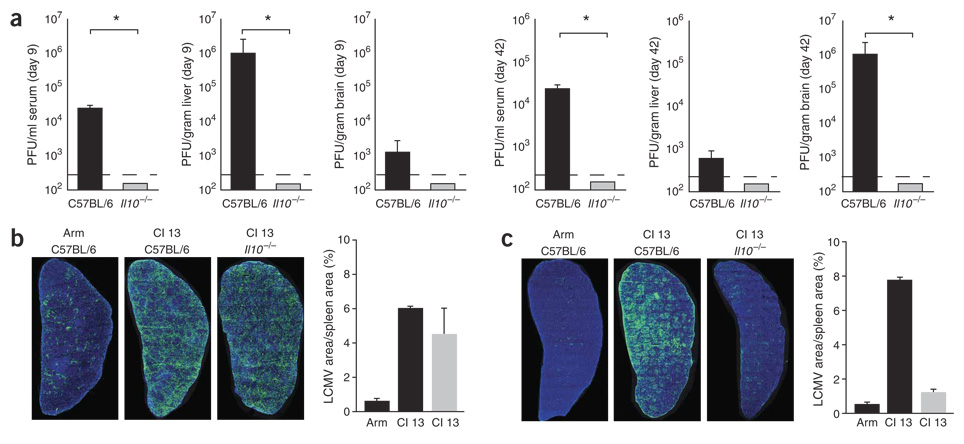
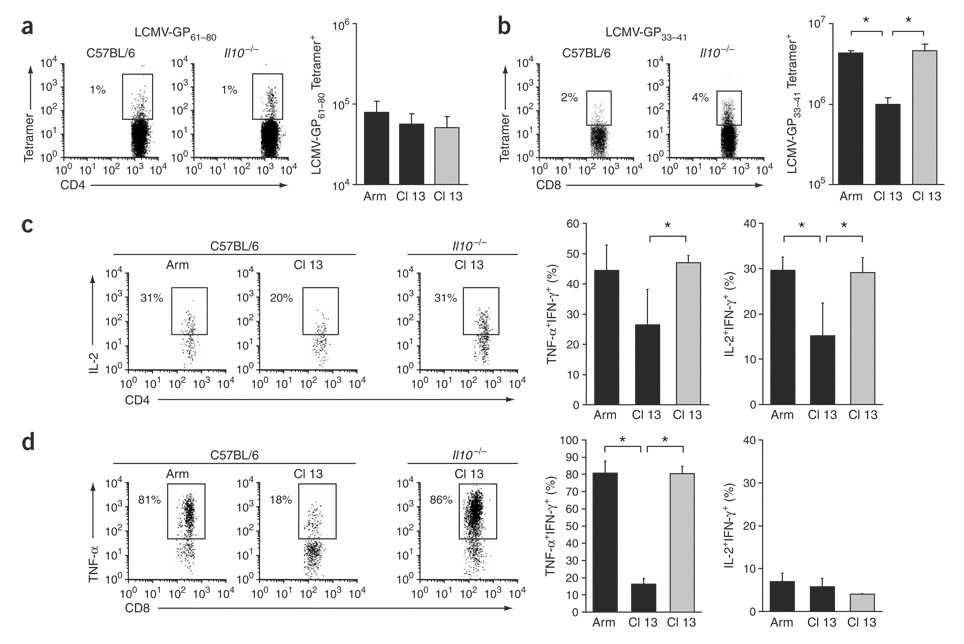
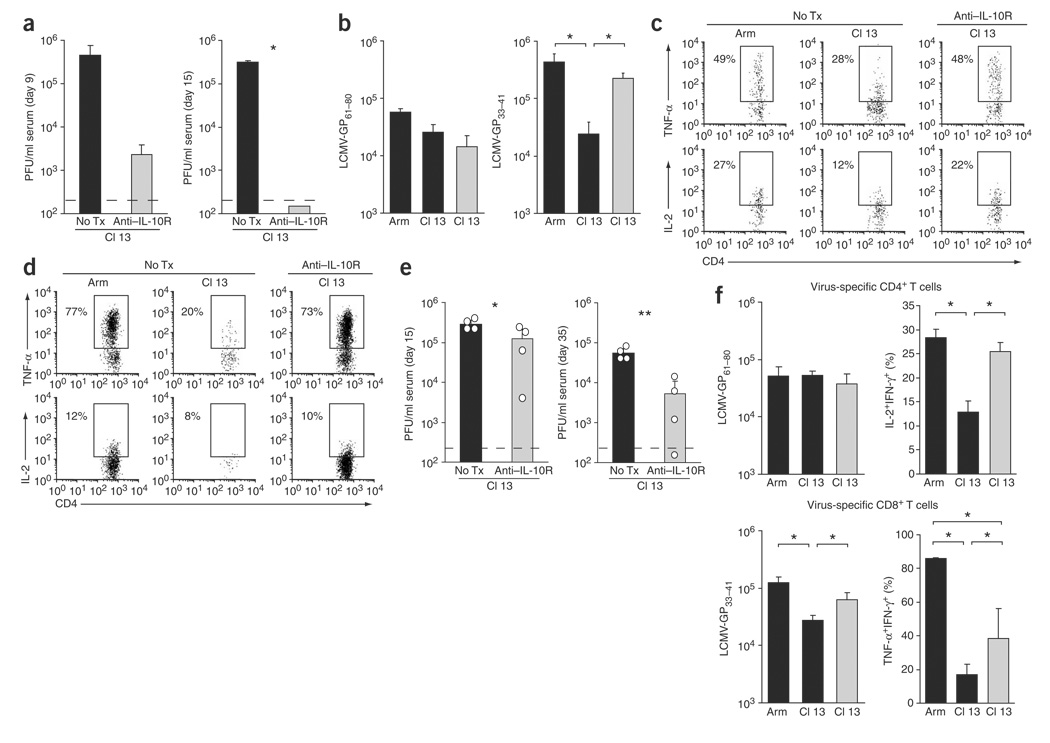
Persistent viral infections are a major health concern. One obstacle inhibiting the clearance of persistent infections is functional inactivation of antiviral T cells. Although such immunosuppression occurs rapidly after infection, the mechanisms that induce the loss of T-cell activity and promote viral persistence are unknown. Herein we document that persistent viral infection in mice results in a significant upregulation of interleukin (IL)-10 by antigen-presenting cells, leading to impaired T-cell responses. Genetic removal of Il10 resulted in the maintenance of robust effector T-cell responses, the rapid elimination of virus and the development of antiviral memory T-cell responses. Therapeutic administration of an antibody that blocks the IL-10 receptor restored T-cell function and eliminated viral infection. Thus, we identify a single molecule that directly induces immunosuppression leading to viral persistence and demonstrate that a therapy to neutralize IL-10 results in T-cell recovery and the prevention of viral persistence.


Figures

Figure 1
Figure 1
Increased IL-10 production during persistent viral infection. (a) RNA protection assay (RPA) was performed on total splenic RNA on day 9 after Arm or Cl 13 infection. Top and bottom bands show the amounts of Il10 and the input control L32 RNA, respectively. (b) Intracellular cytokine analysis was performed on splenocytes 9 d after Arm or Cl 13 infection. DC, B-cell and macrophage analysis was performed by culture in the absence of CD4-specific or CD8-specific peptides. Virus-specific CD4+ and CD8+ T cells were gated on IFN-γ–producing cells after GP61—80 or GP33–41 peptide stimulation. For consistency in analysis, all APC and T-cell subsets were gated on CD45 to analyze IL-10 production. The numbers in each plot indicate the frequency of IL-10–producing cells. (c) Il10 RNA in DCs, B cells, macrophages and CD4+ and CD8+ T cells was analyzed by quantitative RT-PCR on days 5 and 9 after Arm or Cl 13 infection. Il10 RNA production by CD4+ and CD8+ T cells was analyzed on day 9 after infection. Data are represented as the fold increase in Il10 RNA expression in Cl 13–infected cells versus (v.) Arm-infected cells. Data are from pools of spleens from three or four mice per group and are representative of two to four experiments. (d) Il10 RNA levels were measured by quantitative RT-PCR in total splenocytes on day 9 after Cl 13 infection of C57BL/6 or CD4-deficient (Cd4−/−) mice. Data are represented as relative RNA expression compared to a standard curve (r2 > 0.99). Data are from pools of spleens from three or four mice per group and are representative of two experiments. (e) Il10 RNA expression was quantified directly ex vivo in myeloid (MDC), lymphoid (LDC) and plasmacytoid (PDC) DCs by quantitative RT-PCR on RNA isolated on day 9 after Arm or Cl 13 infection. Data are represented as the fold increase in Il10 RNA expression in Cl 13–infected cells versus Arm-infected cells. Data are from pools of spleens from ten mice.
Figure 2
Figure 2
Increased levels of virus-specific T cells after Cl 13 infection of IL-10–deficient mice. (a) Virus-specific CD4+ T cells visualized by I-Ab GP61—80 tetramer staining on day 9 after infection. Flow plots illustrate the frequency of tetramer-positive CD4+ T cells in Cl 13–infected C57BL/6 and Il10−/− mice. The bar graph illustrates the average ± 1 s.d. of tetramer-positive cells on day 9 after Arm or Cl 13 infection of C57BL/6 (black) and Cl 13 infection of IL-10–deficient (gray) mice. *P < 0.03. (b) Virus-specific CD8+ T cells visualized as in a with H-2Db GP33–41 tetramers. Flow plots illustrate tetramer-positive cells in Cl 13–infected C57BL/6 and Il10−/− mice. *P < 0.03. (c) Individual epitope-specific T-cell responses, assessed by ex vivo peptide stimulation with the indicated LCMV peptides on day 9 after Cl 13 infection of C57BL/6 or Il10−/− mice. Flow plots are gated on CD4+ or CD8+ T cells and numbers illustrate the frequency of IFN-γ+ CD4+ and CD8+ T cells. Data are representative of four mice per group and two different experiments.
Figure 3
Figure 3
Sustained effector T cell responses in the absence of IL-10. (a) Cytokine production by CD4+ T cells, assessed by ex vivo stimulation with GP61—80 peptide on day 9 after Arm or Cl 13 infection of C57BL/6 or Il10−/− mice. Flow plots are gated on IFN-γ-producing cells (that is, virus-specific cells) and illustrate the frequency of IL-2–producing, IFN-γ+ cells. The bar graphs indicate the average ± s.d. of the frequency of TNF-α–producing and IL-2–producing IFN-γ+ cells from Arm-infected and Cl 13–infected C57BL/6 mice (black) or Cl 13–infected IL-10–deficient mice (gray). *P < 0.01. (b) Ability of CD8+ T cells to produce effector cytokines after ex vivo stimulation with GP33–41 peptide, analyzed as in a. Flow plots illustrate the average ± s.d. of the frequency of IFN-γ+ cells that produce TNF-α. *P < 0.01. (c) 51Cr cytolytic release assay. Bar graphs represent the percent specific lysis of GP33–41-labeled or NP396–404-labeled target cells by splenocytes from Arm-infected or Cl 13–infected C57BL/6 (black) or Cl 13–infected Il10−/− (gray) mice on day 9 after infection. Values are the average ± s.d. of four mice per group. *P < 0.01.
Figure 4
Figure 4
Increased IL-10 potentiates viral persistence. (a) Titers of infectious virus in serum, liver and brain isolated on days 9 and 42 from Cl 13–infected C57BL/6 and IL-10–deficient mice, as determined by plaque assay. Data are expressed as PFU per milliliter of serum or per gram of tissue. The dashed line indicates the lower limit of detection (200 PFU). Each time point represents the average ± s.d. of three or four mice per group. (b,c) Splenic reconstruction on days 5 (b) and 9 (c) after Arm infection of C57BL/6 mice, Cl 13 infection of C57BL/6 mice and Cl 13 infection of IL-10–deficient mice. Green, LCMV antigen; blue, DAPI (cell nuclei). Graphs illustrate the area of LCMV antigen per unit tissue (that is, the frequency of infected cells) quantified on days 5 and 9 after the indicated infection using image analysis software. Black bars indicate infection of C57BL/6 mice; gray bars indicate infection of IL-10–deficient mice. Values represent the average ± s.d. of two mice per group.
Figure 5
Figure 5
Rapid clearance of persistent viral infection facilitates memory T-cell development. (a) Virus-specific CD4+ T cells visualized by I-Ab GP61—80 tetramer staining on day 42 after infection as described in Figure 2a. Flow plots illustrate the frequency of tetramer-positive CD4+ T cells in C57BL/6 (left) and Il10−/− (right) mice infected with Cl 13. The bar graph illustrates the number of GP61—80 tetramer–positive cells on day 42 after Arm and Cl 13 infection of C57BL/6 mice (black) and Cl 13 infection of Il10−/− mice (gray). (b) Virus-specific CD8+ T cells visualized as in Figure 2b with H-2Db GP33–41 tetramers; the bar graph shows the number of tetramer-positive cells. *P < 0.01. (c) Cytokine production by virus-specific CD4+ T cells, assessed on day 42 after Arm or Cl 13 infection of C57BL/6 mice (black) and Cl 13 infection of IL-10–deficient mice (gray bars). Flow plots illustrate the frequency of IL-2 producing, IFN-γ+ cells. Bar graphs, TNF-α and IL-2 production by IFN-γ+ cells. Data are representative of the average ± s.d. of four mice per group. *P < 0.01. (d) The ability of CD8+ T cells to produce effector cytokines after ex vivo stimulation with GP33–41 peptide, analyzed as described in Figure 6c. Flow plots illustrate the frequency of TNF-α producing, IFN-γ+ cells. Bar graphs, TNF-α and IL-2 production by IFN-γ+ cells. *P < 0.01.
Figure 6
Figure 6
Treatment with antibody to IL-10R to prevent or treat persistent viral infection. (a) C57BL/6 mice were infected with Cl 13 and either left untreated (No Tx) or treated with an IL-10R–blocking antibody on days 1 and 5 after infection. The amount of infectious virus in the serum was quantified on days 9 and 15 after infection. Data are representative of the average ± s.d. of four mice per group. *P < 0.001. (b) After IL-10R–antibody treatment was initiated on day 1 after infection, virus-specific CD4+ (GP61—80) and CD8+ (GP33–41) T cells were quantified on day 40 after infection by tetramer staining. The bar graphs show the number of tetramer-positive cells in untreated (black bars) and IL-10R–antibody–treated (gray bars) mice. Data are representative of the average ± s.d. of four mice per group. *P < 0.01. (c,d) Cytokine production by virus-specific CD4+ (c) and CD8+ (d) T cells was assessed in Arm-infected, Cl 13–infected and IL-10R–antibody–treated Cl 13–infected C57BL/6 mice 40 d after infection. Treatment was initiated on day 1 after infection. Flow plots are gated on IFN-γ+ cells and illustrate the frequency of TNF-α–producing or IL-2–producing, IFN-γ+ cells. Data are representative of four mice per group. (e) Serum viral titers in Cl 13–infected C57BL/6 mice either left untreated or treated at 12 d after infection with antibody to IL-10R. The bars in each graph represent the average ± s.d. of four mice per group and the circles indicate the exact value for each mouse in that group. *P < 0.05; **P < 0.005. (f) The number of virus-specific CD4+ (GP61—80) and CD8+ (GP33–41) T cells was quantified by tetramer staining on day 35 after infection in Arm-infected and Cl 13–infected C57BL/6 (black bars) and IL-10R antibody–treated Cl 13–infected (gray bars) mice. Antibody treatment was initiated 10 d after infection. IL-2 production by virus-specific CD4+ T cells and TNF-α production by virus-specific CD8+ T cells was assessed by gating on IFN-γ+ cells and the bar graphs illustrate the frequency of TNF-α or IL-2 producing, IFN-γ+ cells. Similar data were obtained for TNF-α production by virus-specific CD4+ T cells and IL-2 production by virus-specific CD8+ T cells (data not shown). Values represent the average ± s.d. of four mice per group. *P < 0.05.

Comment in

References

    1. Brooks DG, Teyton L, Oldstone MB, McGavern DB. Intrinsic functional dysregulation of CD4 T cells occurs rapidly following persistent viral infection. J. Virol. 2005;79:10514–10527. - PMC - PubMed
    1. Gallimore A, et al. Induction and exhaustion of lymphocytic choriomeningitis virus-specific cytotoxic T lymphocytes visualized using soluble tetrameric major histocom-patibility complex class I-peptide complexes. J. Exp. Med. 1998;187:1383–1393. - PMC - PubMed
    1. Lechner F, et al. Analysis of successful immune responses in persons infected with hepatitis C virus. J. Exp. Med. 2000;191:1499–1512. - PMC - PubMed
    1. Rosenberg ES, et al. Immune control of HIV-1 after early treatment of acute infection. Nature. 2000;407:523–526. - PubMed
    1. Thimme R, et al. Determinants of viral clearance and persistence during acute hepatitis C virus infection. J. Exp. Med. 2001;194:1395–1406. - PMC - PubMed

Publication types

MeSH terms