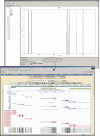
REEF: searching REgionally Enriched Features in genomes
- PMID: 17042935
- PMCID: PMC1624853
- DOI: 10.1186/1471-2105-7-453
REEF: searching REgionally Enriched Features in genomes
Abstract
Background: In Eukaryotic genomes, different features including genes are not uniformly distributed. The integration of annotation information and genomic position of functional DNA elements in the Eukaryotic genomes opened the way to test novel hypotheses of higher order genome organization and regulation of expression.
Results: REEF is a new tool, aimed at identifying genomic regions enriched in specific features, such as a class or group of genes homogeneous for expression and/or functional characteristics. The method for the calculation of local feature enrichment uses test statistic based on the Hypergeometric Distribution applied genome-wide by using a sliding window approach and adopting the False Discovery Rate for controlling multiplicity. REEF software, source code and documentation are freely available at http://telethon.bio.unipd.it/bioinfo/reef/.
Conclusion: REEF can aid to shed light on the role of organization of specific genomic regions in the determination of their functional role.
Figures


Similar articles
-
CEGMA: a pipeline to accurately annotate core genes in eukaryotic genomes.Bioinformatics. 2007 May 1;23(9):1061-7. doi: 10.1093/bioinformatics/btm071. Epub 2007 Mar 1. Bioinformatics. 2007. PMID: 17332020
-
FLOSS: flexible ordered subset analysis for linkage mapping of complex traits.Bioinformatics. 2006 Feb 15;22(4):512-3. doi: 10.1093/bioinformatics/btk012. Epub 2005 Dec 20. Bioinformatics. 2006. PMID: 16368771
-
SITEBLAST--rapid and sensitive local alignment of genomic sequences employing motif anchors.Bioinformatics. 2005 May 1;21(9):2093-4. doi: 10.1093/bioinformatics/bti224. Epub 2004 Dec 14. Bioinformatics. 2005. PMID: 15598827
-
Statistical software for gene mapping by admixture linkage disequilibrium.Brief Bioinform. 2007 Nov;8(6):393-5. doi: 10.1093/bib/bbm035. Epub 2007 Jul 18. Brief Bioinform. 2007. PMID: 17640923 Review.
-
[Strategies for structural anaysis of genomes].Tanpakushitsu Kakusan Koso. 2004 Aug;49(11 Suppl):1828-33. Tanpakushitsu Kakusan Koso. 2004. PMID: 15377024 Review. Japanese. No abstract available.
Cited by
-
Systems biological approaches towards understanding cellulase production by Trichoderma reesei.J Biotechnol. 2013 Jan 20;163(2):133-42. doi: 10.1016/j.jbiotec.2012.05.020. Epub 2012 Jun 29. J Biotechnol. 2013. PMID: 22750088 Free PMC article. Review.
-
AIRE activated tissue specific genes have histone modifications associated with inactive chromatin.Hum Mol Genet. 2009 Dec 15;18(24):4699-710. doi: 10.1093/hmg/ddp433. Epub 2009 Sep 10. Hum Mol Genet. 2009. PMID: 19744957 Free PMC article.
-
Study of Gene Trafficking between Acanthamoeba and Giant Viruses Suggests an Undiscovered Family of Amoeba-Infecting Viruses.Genome Biol Evol. 2016 Dec 14;8(11):3351-3363. doi: 10.1093/gbe/evw260. Genome Biol Evol. 2016. PMID: 27811174 Free PMC article.
-
Analysis of Light- and Carbon-Specific Transcriptomes Implicates a Class of G-Protein-Coupled Receptors in Cellulose Sensing.mSphere. 2017 May 10;2(3):e00089-17. doi: 10.1128/mSphere.00089-17. eCollection 2017 May-Jun. mSphere. 2017. PMID: 28497120 Free PMC article.
-
A molecular view of the normal human thyroid structure and function reconstructed from its reference transcriptome map.BMC Genomics. 2017 Sep 18;18(1):739. doi: 10.1186/s12864-017-4049-z. BMC Genomics. 2017. PMID: 28923001 Free PMC article.
References
-
- Caron H, van Schaik B, van der Mee M, Baas F, Riggins G, van Sluis P, Hermus MC, van Asperen R, Boon K, Voute PA, Heisterkamp S, van Kampen A, Versteeg R. The human transcriptome map: clustering of highly expressed genes in chromosomal domains. Science. 2001;291:1289–1292. doi: 10.1126/science.1056794. - DOI - PubMed
-
- Versteeg R, van Schaik BD, van Batenburg MF, Roos M, Monajemi R, Caron H, Bussemaker HJ, van Kampen AH. The human transcriptome map reveals extremes in gene density, intron length, GC content, and repeat pattern for domains of highly and weakly expressed genes. Genome Res. 2003;13:1998–2004. doi: 10.1101/gr.1649303. - DOI - PMC - PubMed
-
- Roy PJ, Stuart JM, Lund J, Kim SK. Chromosomal clustering of muscle-expressed genes in Caenorhabditis elegans. Nature. 2002;418:975–979. - PubMed
Publication types
MeSH terms
LinkOut - more resources
Full Text Sources
Molecular Biology Databases

