. 2006 Oct 23;175(2):337-47.
doi: 10.1083/jcb.200602125. Epub 2006 Oct 16.

Endosomes generate localized Rho-ROCK-MLC2-based contractile signals via Endo180 to promote adhesion disassembly

Affiliations

Endosomes generate localized Rho-ROCK-MLC2-based contractile signals via Endo180 to promote adhesion disassembly

Justin Sturge et al. J Cell Biol. .

Abstract

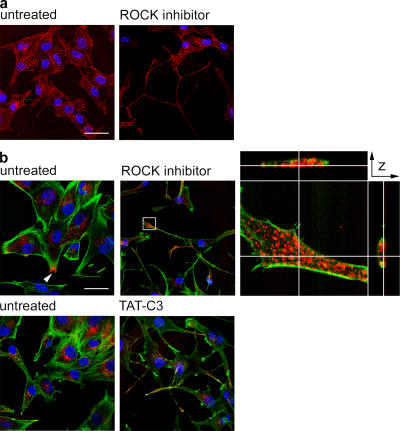
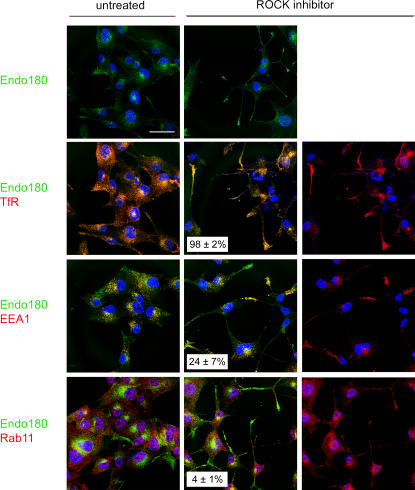
The regulated assembly and disassembly of focal adhesions and adherens junctions contributes to cell motility and tumor invasion. Pivotal in this process is phosphorylation of myosin light chain-2 (MLC2) by Rho kinase (ROCK) downstream of Rho activation, which generates the contractile force necessary to drive disassembly of epithelial cell-cell junctions and cell-matrix adhesions at the rear of migrating cells. How Rho-ROCK-MLC2 activation occurs at these distinct cellular locations is not known, but the emerging concept that endocytic dynamics can coordinate key intracellular signaling events provides vital clues. We report that endosomes containing the promigratory receptor Endo180 (CD280) can generate Rho-ROCK-MLC2-based contractile signals. Moreover, we provide evidence for a cellular mechanism in which Endo180-containing endosomes are spatially localized to facilitate their contractile signals directly at sites of adhesion turnover. We propose migration driven by Endo180 as a model for the spatial regulation of contractility and adhesion dynamics by endosomes.


Figures

Figure 1.
Figure 1.
Endo180 is required for contractile signals and rear cell deadhesion. (a–c) MG63 cells were plated onto uncoated glass coverslips or tissue culture plastic and treated with 0.3 μM ROCK inhibitor for 16 h or mock transfected, transfected with nontargeting scrambled Endo180 siRNA oligonucleotides (control), Endo180 single siRNA oligonucleotides (Endo180 siRNA), Endo180 SMARTPool siRNA oligonucleotides (Endo180 siRNA SP), or siRNA oligonucleotides against transferrin receptor (TfR), LDLR, or uPAR, and cultured for 72 h. (a) Cells were fixed, and the actin cytoskeleton was visualized by staining with Alexa 488 phalloidin (green). Cell nuclei were counterstained with TO-PRO-3 (blue). Bar, 50 μm. Images are representative of four separate experiments. (b) Cells in panel a were scored for tail formation by counting >100 cells in each of four separate experiments. Data are mean ± SEM. *, P < 0.0001, compared with untreated cells. (c) Cell lysates were resolved by SDS-PAGE and immunoblotted to detect diphospho-MLC2 and total MLC2. (top) A representative immunoblot of four separate experiments. (bottom) MLC2 phosphorylation levels quantified by densitometry. Data are mean ± SEM. *, P < 0.0001, compared with control. n = 4. (d) MDA-MB-231, HT-1080, BE, and MG63 cells were plated onto tissue culture plastic and treated with control or Endo180 siRNA oligonucleotides for 72 h, and levels of diphospho-MLC2 and total MLC2 were detected as described for panel c. Data are mean of four separate experiments ± SEM. *, P < 0.01, compared with control.
Figure 2.
Figure 2.
Endo180-generated contractile signals and rear cell deadhesion are not dependent on the extracellular matrix. (a) MG63 cells were transfected with nontargeting (control) or targeting siRNA oligonucleotides against Endo180 for 72 h. Cells were seeded onto uncoated coverslips or coverslips coated with fibronectin, collagen type I, or Matrigel and allowed to adhere and spread for 4 h before fixation. The actin cytoskeleton was visualized by staining with Alexa 488 phalloidin (green), and cell nuclei were counterstained with TO-PRO-3 (blue). Images shown are representative of two separate experiments. Bar, 50 μm. (b) MG63 cells seeded onto uncoated tissue culture plastic or tissue culture plastic coated with fibronectin, collagen type I, or Matrigel were transfected with nontargeting (control) or targeting siRNA oligonucleotides against Endo180 for 72 h. Cell lysates were resolved by SDS-PAGE and immunoblotted to detect diphospho-MLC2 and total MLC2. (top) A representative immunoblot from a single experiment. (bottom) MLC2 phosphorylation levels quantified by densitometry. Data are mean of two separate experiments ± SEM.
Figure 3.
Figure 3.
Tails produced by targeted inhibition of Endo180 or ROCK result from defective rear cell deadhesion and increased cell body movement. MG63 cells were left untreated or treated with siRNA oligonucleotides (control or Endo180) for 72 h before plating onto uncoated coverslips. Cells were allowed to adhere for 1 h before cellular dynamics were visualized by time-lapse video microscopy (see Videos 1–3, available at http://www.jcb.org/cgi/content/full/jcb.200602125/DC1). 1 μM ROCK inhibitor was added to untreated cells 30 min before image collection and was present during image collection. (a) Stills from representative time-lapse videos taken at 0 h, 30 min, 1 h, and 4 h are shown. Arrows indicate examples of the tails formed during the assay. Bar, 50 μm. (b) Cells from time-lapse videos were quantified for their cell body movement. Data are mean cell body movement in μm/h ± SEM; >100 cells were analyzed in each of three separate experiments. *, P < 0.0001, compared with control levels.
Figure 4.
Figure 4.
Endo180 activates the Rho–ROCK signaling pathway. (a and b) MG63 cells plated on uncoated tissue culture plastic were treated with control or Endo180 siRNA oligonucleotides for 72 h or untreated/treated with 0.3 μM ROCK inhibitor for 4 h. (a) Cell lysates were immunoblotted to detect phosphorylation of MLC2 at serine 19, total MLC2, MYPT1 phosphorylation at threonine 696, total MYPT1, phosphorylation of LIMK1/2 at threonine 508/threonine 505, and total LIMK1. (top) Representative immunoblots. (bottom) Phosphorylation levels of the indicated ROCK targets quantified by densitometry. Data are mean of three separate experiments ± SEM. *, P < 0.01, compared with control siRNA or untreated levels. (b) Active Rho was affinity precipitated from cell lysates, and precipitates and cell lysates were immunoblotted to detect active and total Rho levels, respectively. (top) A representative immunoblot. (bottom) Rho activation levels quantified by densitometry. Data are mean of five separate experiments ± SEM. *, P < 0.00001, compared with control siRNA levels. (c) MG63 cells were left untreated or treated with TAT-C3 toxin for 16 h. The actin cytoskeleton was visualized by staining with Alexa 488 phalloidin (green), and cell nuclei were counterstained with TO-PRO-3 (blue). Images shown are representative of two separate experiments. Bar, 25 μm.
Figure 5.
Figure 5.
Endosomes containing Endo180 localize at cell–matrix adhesion sites and strongly accumulate in unretracted tails. MG63 cells were plated onto uncoated glass coverslips. (a) To label cell surface Endo180, cells were left untreated or treated for 4 h with 0.3 μM ROCK inhibitor and incubated at 4°C with anti-Endo180 mAb A5/158 before fixation and addition of Alexa 555 anti-mouse Ig (red) and counterstaining of nuclei with TO-PRO-3 (blue). (b) Cells were left untreated or treated with 0.3 μM ROCK inhibitor for 4 h or TAT-C3 for 16 h. Cells were fixed and stained with Alexa 488 phalloidin to visualize the actin cytoskeleton (green), anti-Endo180 mAb A5/158 (red), and nuclei counterstained with TO-PRO-3 (blue). Bar, 50 μm. Arrowhead indicates endosomes containing Endo180 accumulating at stress fiber termini in untreated cells. The far right image shows boxed area at higher (8×) magnification. z sections show that Endo180-positive endosomes strongly accumulate inside unretracted tails of ROCK inhibitor–treated cells.
Figure 6.
Figure 6.
Endo180 in unretracted tails colocalizes with transferrin receptor and accumulates in early sorting but not recycling endosomes. MG63 cells plated onto uncoated coverslips were left untreated or treated with 0.3 μM ROCK inhibitor for 4 h, fixed, and stained with anti-Endo180 mAb A5/158 (green) and antibodies against transferrin receptor (TfR), EEA1, or Rab11 as markers of different endosomal compartments (red). Nuclei were counterstained with TO-PRO-3 (blue). Images shown are representative of three separate experiments. Bar, 25 μm. Values represent the percentage of unretracted tails in ROCK inhibitor–treated cells that show coaccumulation of Endo180 with TfR, EEA1, or Rabl11. Data represents >50 cells counted in each of three separate experiments ± SEM.
Figure 7.
Figure 7.
Endo180-positive endosomes directly localize at sites of cell–matrix adhesion with increased contractile signals. MG63 cells plated onto uncoated coverslips were fixed and stained with Alexa 488 phalloidin to visualize the actin cytoskeleton (green), anti-Endo180 mAb A5/158 (red), and anti–diphosphorylated MLC2 (blue). Two representative images are shown. Asterisks indicate regions shown in the right-hand images at higher (4×) magnification. Bar, 50 μm.
Figure 8.
Figure 8.
Internalization of Endo180 into endosomes promotes spatial adhesion turnover. (a) Vector alone, Endo180, and Endo180(Ala1468/Ala1469) transfected MCF7 cells were plated onto Matrigel-coated coverslips for 4 h, fixed, and stained with Alexa 488 phalloidin to visualize the actin cytoskeleton (green). Anti-talin was used as a marker of focal adhesion (red), and nuclei were counterstained with TO-PRO-3 (blue). Images shown are representative of three separate experiments. Bar, 50 μm. (b) Transfected MCF7 cells were plated onto Matrigel-coated tissue culture plastic for 1 h, and the percentage of adherent cells relative to vector alone transfected MCF7 is shown as mean of three separate experiments ± SEM.
Figure 9.
Figure 9.
Internalization of Endo180 into endosomes promotes the generation of contractile signals. Cells were plated onto Matrigel-coated tissue culture plastic. (a) Serum-starved vector alone, Endo180, and Endo180(Ala1468/Ala1469) transfected MCF7 cells were treated with or without 10% FCS for 10 min. Lysates were resolved by SDS-PAGE and diphospho-MLC2 and total MLC2 detected by immunoblotting. (bottom) Representative immunoblots from 10 separate experiments. (top) MLC2 phosphorylation levels quantified by densitometry. Data are mean ± SEM. n = 10. *, P < 0.001, compared with FCS-stimulated vector alone and Endo180(Ala1468/Ala1469) transfected MCF7 cells. (b) Serum-starved vector alone and Endo180 transfected MCF7 cells were treated with or without 10% FCS for 10 min, washed twice in PBS, and incubated in serum-free medium for 10 min, 30 min, 1 h, or 2 h. Cells were lysed, and diphospho-MLC2 and total MLC2 were detected by immunoblotting. (top) Representative immunoblots from two separate experiments. (bottom) MLC2 phosphorylation levels quantified by densitometry. Data are mean ± SEM. n = 2. (c and d) Serum-starved vector alone or Endo180 transfected MCF7 cells were either untreated or treated with primaquine for 30 min. (c) The cell surface levels of Endo180, transferrin receptor (TfR), and β1 integrin (CD29) was assessed by flow cytometry. Data shown are mean relative fluorescent intensity normalized against isotype-matched IgG binding. (d) Cell lysates were resolved by SDS-PAGE, and Endo180 was detected by immunoblotting. (e) Serum-starved vector alone and Endo180 transfected MCF7 cells were untreated or treated with primaquine for 30 min. Where indicated, cells were incubated with 0.3 μM ROCK inhibitor for 1 h before primaquine stimulation. Lysates were resolved by SDS-PAGE, and diphospho-MLC2 and total MLC2 were detected by immunoblotting. (bottom) Representative immunoblots from four separate experiments. (top) MLC2 phosphorylation levels quantified by densitometry. Data are mean ± SEM. *, P < 0.05, compared to all other treatments. n = 4.
Figure 10.
Figure 10.
Endo180 disrupts cell–cell adhesions through activation of ROCK-based contractility. Cells were plated onto Matrigel-coated tissue culture plastic. (a) Vector alone or Endo180 transfected MCF7 cells untreated or treated with 0.3 μM ROCK inhibitor for 24 h were fixed and stained for E-cadherin (red), and nuclei were counterstained with TO-PRO-3 (blue). Images shown are representative of three separate experiments. Bar, 25 μm. (b) E-cadherin junctional staining of cells, shown in panel a, were scored as weak, intermediate, or strong. 7–10 fields of view were scored from each of three separate experiments. Data are mean percentage of cells in each category ± SEM. *, P < 0.05, compared with vector alone transfected cells. (c) Endo180 transfected MCF7 cells were treated with control or Endo180 siRNA oligonucleotides, fixed, and stained to visualize E-cadherin (red), Endo180 (green), and cell nuclei (blue). Images shown are representative of three separate experiments. Bar, 25 μm. (d) E-cadherin junctional staining was scored as described for panel c. 7–10 fields of view from each of three separate experiments were scored. Data are the mean percentage of cells in each category ± SEM. *, P < 0.05, compared with control siRNA transfected cells.

Similar articles

Cited by

References

    1. Alblas, J., L. Ulfman, P. Hordijk, and L. Koenderman. 2001. Activation of RhoA and ROCK are essential for detachment of migrating leukocytes. Mol. Biol. Cell. 12:2137–2145. - PMC - PubMed
    1. Behrendt, N. 2004. The urokinase receptor (uPAR) and the uPAR-associated protein (uPARAP/Endo180): membrane proteins engaged in matrix turnover during tissue remodeling. Biol. Chem. 385:103–136. - PubMed
    1. Behrendt, N., O.N. Jensen, L.H. Engelholm, E. Mortz, M. Mann, and K. Dano. 2000. A urokinase receptor-associated protein with specific collagen binding properties. J. Biol. Chem. 275:1993–2002. - PubMed
    1. Bretscher, M.S. 1992. Cells can use their transferrin receptors for locomotion. EMBO J. 11:383–389. - PMC - PubMed
    1. Carragher, N.O., and M.C. Frame. 2004. Focal adhesion and actin dynamics: a place where kinases and proteases meet to promote invasion. Trends Cell Biol. 14:241–249. - PubMed

Publication types

MeSH terms