. 2006 Nov;128(5):547-59.
doi: 10.1085/jgp.200609644. Epub 2006 Oct 16.

Cross talk between activation and slow inactivation gates of Shaker potassium channels

Affiliations

Cross talk between activation and slow inactivation gates of Shaker potassium channels

Gyorgy Panyi et al. J Gen Physiol. 2006 Nov.

Abstract

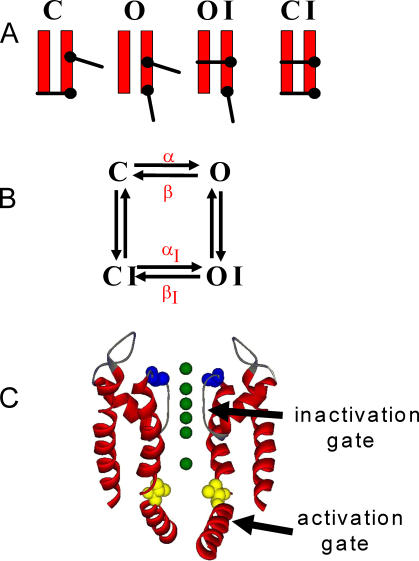
This study addresses the energetic coupling between the activation and slow inactivation gates of Shaker potassium channels. To track the status of the activation gate in inactivated channels that are nonconducting, we used two functional assays: the accessibility of a cysteine residue engineered into the protein lining the pore cavity (V474C) and the liberation by depolarization of a Cs(+) ion trapped behind the closed activation gate. We determined that the rate of activation gate movement depends on the state of the inactivation gate. A closed inactivation gate favors faster opening and slower closing of the activation gate. We also show that hyperpolarization closes the activation gate long before a channel recovers from inactivation. Because activation and slow inactivation are ubiquitous gating processes in potassium channels, the cross talk between them is likely to be a fundamental factor in controlling ion flux across membranes.


Figures

Figure 1.
Figure 1.
States of the channel. (A) Composite states are depicted with an activation gate (lower gate) and an inactivation gate (upper gate), each in one of two possible configurations. The composite states are C (closed), O (open), OI (inactivated), and CI (inactivated). (B) A simplified four-state gating model with rate constants for the opening (α, αI) and closing rates (β, βI) of the activation gate. (C) Structure of the pore region (residues 322–450) of Kv1.2 made in DS ViewerPro (www.accelrs.com) from Long et al. (2005). Two subunits are shown as ribbon representations, and residues homologous to Shaker 449 (blue) and 474 (yellow) are depicted as space-filling atoms. K+ ions are shown as green spheres.
Figure 2.
Figure 2.
Characterization of the perfusion kinetics. (A) Components of solution exchange. The patch was held at −120 mV in the presence of 150 mM intracellular K+ and depolarized to +50 mV for 600 ms with concomitant switching of the intracellular solution to one containing 50 mM K+ for the first 300 ms of the depolarizing step (hatched portion of bar). The kinetics of the solution change are depicted in the current trace as a rapid decrease in current. The mechanical and electrical delay is d, and the fit of a single exponential to the falling phase of the current gives the time constant of the solution exchange, τe. (B) Box plots of d and τe indicate median values of 33 ms and 4.1 ms, respectively.
Figure 3.
Figure 3.
Biophysical properties of the channel. (A) Macroscopic K+ currents in the inside-out configuration. For the composition of the solutions, see Materials and methods. The patch was held at −120 mV and depolarized to test potentials ranging from −80 to +70 mV in 10-mV increments every 45 s. The duration of the depolarizing pulses was 300 ms. Sampling frequency was 10 kHz. Data were filtered at 5 kHz. Leak was subtracted online using a P/5 protocol. (B) Voltage dependence of P O. The P O at each test potential (•) was calculated as P O = IV/IV,t, where IV and IV,t are the peak current and the peak tail current, respectively, measured at membrane potential V. The tail current protocol consisted of a 7-ms step to +50 mV, followed by a 10-ms step to a membrane potential ranging from +70 to −140 mV. IV,t was measured during the second step. The line shows the best fit Boltzmann function. The mean values ± SEM of the midpoint (V1/2) and slope factor (s) are shown (n = 3). (C) Voltage dependence of steady-state inactivation. The fraction of noninactivated channels at each voltage (▴) was calculated as I/I−120, where I is the peak current evoked by 7-ms depolarization to +50 mV from a prepulse potential applied for 60 s, whereas I−120 is the peak current evoked by identical depolarization from the holding potential of −120 mV. The line shows the best fit Boltzmann function. The mean values ± SEM of the V1/2 and slope factor are shown (n = 3). (D) Deactivation kinetics of the current. In the protocol used, tail currents were evoked by stepping to the indicated membrane potentials after a 7-ms depolarization to +50 mV. The deactivation time constant (τd) was determined by fitting a single exponential function to the decaying tail currents. The bars indicate the mean + SEM (n > 5). The time constant is the reciprocal of the rate constant for channel closure (β) in Fig. 1. (E) Kinetics of recovery from inactivation. In the protocol used, pairs of depolarizing pulses were delivered from the holding potential of −120 to +50 mV for 1.5 s. The ipi at −120 mV varied between 0 and 60 s. The FR was calculated as I2−Iss1/I1−Iss1, where I2 and I1 are the peak currents during the second and first pulse, respectively, and Iss1 is the current at the end of the first depolarization. The FR versus ipi plot was fit with an exponential function to give a time constant. Data are given as mean ± SEM (n = 4).
Figure 4.
Figure 4.
Status of the activation gate. (A, C, E, G, I, and K) Patches were repeatedly depolarized from a holding potential of −120 mV using the pulse protocols shown above the corresponding raw current traces. Pulse protocols, with appropriate interpulse intervals, were run three to four times in the absence of MTSET to verify the stability of the peak currents (not depicted). The timing and the duration (L) of the MTSET pulse are indicated by the hatched bars. A gradual decrease of the peak currents during repetitive pulsing occurred if the activation gate of the channel was open during MTSET application. (B, D, F, H, J, and L) The peak currents for each pulse were determined and normalized to the peak current of the first pulse and plotted as a function of the cumulative modification time, which is calculated using Eq. 1 in Analysis of Data. Values for k mod, shown in B, H, J, and L, are measured modification rates corrected for time-dependent changes in P O or P OI. (A and B) Depolarizing pulses were applied in the continuous presence of 200 μM MTSET; thus, d and τe are both 0 in Eq. 1. The modification rate was corrected by multiplying by 1.39, a factor derived from Eq. 3 using the activation kinetics of the normalized current, P O(t) = (1−e−t/τ)4 and P O,max = 1 (see Analysis of Data). (C and D) [MTSET] = 200 μM, L = 500 ms. MTSET application was initiated 400 ms after returning to −120 mV. (E and F) [MTSET] = 200 μM, L = 400 ms. MTSET application was initiated 800 ms after the start of the depolarization. (G and H) [MTSET] = 200 μM, L = 400 ms. MTSET application was initiated 800 ms after the start of the depolarization. The modification rate was corrected by multiplying by 1.28, a factor derived from Eq. 3 using an exponential decay function for P OI(t) based on determination of βI (Fig. 5). (I and J) The duration of the depolarizing pulse to +50 mV was trimmed to 80 ms to result in POI = 0.52. Note the 5-ms step to −120 mV (indicated by the asterisk), which closed the activation gate of the open channels at the end of the depolarizing pulse (Fig. 1 and Fig. 3). [MTSET] = 200 μM, L = 400 ms. MTSET application was initiated 80 ms after the start of the depolarization. The modification rate was corrected by multiplying by 1.28, a factor derived from Eq. 3 using an exponential decay function for P OI(t) based on determination of βI (Fig. 5). (K and L) [MTSET] = 200 μM, L = 500 ms. MTSET application was coincident with the second depolarization to +50 mV. The modification rate was corrected by multiplying by 1.004, a factor derived from Eq. 3 using a fourth-power function shown above in A and B for P O(t).
Figure 5.
Figure 5.
Rate of activation gate closure in the inactivated channel. The pulse protocols (A, D, and G) were based on Fig. 4 I, with the following modification: complete inactivation of the channels was followed by pulses of varying duration at −120 (A–C), −105 (D–F), or −80 (G–I) mV before MTSET application. In all cases, MTSET was applied at −80 mV for 400 ms (hatched bar). This membrane potential is optimal for determining the status of the activation gate (Fig. 3, B and C; and Fig. 4). MTSET concentration was adjusted to achieve complete modification of the channels in <10 episodes (B, 200 μM; E, 400 μM; H, 200 μM). (C, F, and I) Modification rate constants are plotted as a function of pulse duration at −120 (C), −105 (F), or −80 (I) mV preceding MTSET application. The data points were fit with a single exponential function to give the indicated time constants, which are reciprocals of the rate constants formula image characterizing the OI→CI transition (Fig. 1 B).
Figure 6.
Figure 6.
Cs+i trapping and liberation. After inactivation, FR was measured using an ipi that gave 90% recovery when K+ was present continuously (raw current trace, ipi = 21 s), which corresponds to protocol 1. The open bar indicates perfusion of the patch with KF/KCl intracellular solution. Protocol 2 indicates that a Cs+i pulse (shaded portion of the bar) was applied so as to overlap with the transition from depolarized (+50 mV) to hyperpolarized (−120 mV) membrane potential (total pulse duration was 550 ms, including 300 ms at +50 mV and 250 ms at −120 mV). Cs+i was washed out by reperfusion with the KF/KCl solution. Protocol 3 indicates that K+ was present continuously but that a 7-ms depolarizing voltage step was applied to reopen the activation gate. This latter pulse was applied 400 ms after initially returning to −120 mV. In protocol 4, a Cs+i pulse was applied (identical to that in protocol 2), and Cs+i was washed out, followed by a 7-ms depolarizing voltage step to +50 mV to reopen the channel. This latter pulse was applied 400 ms after initially returning to −120 mV and results in exchange of Cs+ for K+. Protocol 4 tests the ability of a depolarizing pulse to +50 mV to restore FR to levels observed after repolarization in K+ only. Bars at right show resulting FR (n ≥ 3). Cs+-exposed channels deprived of a liberation pulse yield lower FRs than non–Cs+-exposed chan-nels (P < 0.05).
Figure 7.
Figure 7.
Rate of activation gate opening in inactivated channels. (A–C) Kinetics of activation and liberation after Cs+ loading and unloading of the inactivated channel. Liberation was performed at +50 (A), −50 (B), or −55 (C) mV. The black trace shows normalized current (left y axis) after a step to the indicated voltage (n = 3). Gray swaths on either side of the line represent standard error of the current amplitude. Red circles show FR (right y axis) measured using a protocol similar to that shown in Fig. 6 (protocol 4), except that the liberation step was to the indicated voltage and the step duration was varied as indicated, depending on the liberation voltage. Data are represented as means ± SEM (n ≥ 3). In C, the continuous red line represents a fit of the data to a fourth-power sigmoidal function. Activation time constants measured from current traces are 0.94 ± 0.02 (n = 4), 5.9 ± 0.28 (n = 14), and 9.4 ± 1.05 ms (n = 6) for +50, −50, and −55 mV, respectively. (D) FR after steady-state liberation. FR was measured according to protocol 4 (Fig. 6) after a liberation pulse of 300 ms at −55, −60, and −70 mV (shaded bars labeled as Cs,−55; Cs,−60; and Cs,−70, respectively). For comparison, FR was also measured for channels held continuously at −120 mV and exposed to formula image only (open bar labeled as K) or to formula image only (shaded bar labeled as Cs), or to formula image only, but subject to a depolarization to −55 mV (open bar labeled as K,−55) for 300 ms (protocols 1, 2, and 3, respectively, in Fig. 6). Because the 300-ms depolarization to −55 mV in formula image did not affect FR, no additional controls were necessary for −60 and −70 mV. FRs for −55, −60 and −70 mV are significantly different based on a two-step statistical analysis. First, a one-way ANOVA was performed on all the data, followed by an all-pairwise multiple comparison (Student-Newman-Keuls method) to give a P value <0.05 in all cases. Extensive simulations using linear multistate gating models with one open state showed that in all cases (i.e., widely varied values of rate constants) the normalized P O(t) is always greater than or equal to the time-dependent first latency for reaching the open state in the same model. This observation leads to our general conclusion that activation kinetics are never slower than liberation kinetics at the same voltage, unless gating rate constants differ between inactivated and noninactivated channels.

Similar articles

Cited by

References

    1. Ashcroft, F.M. 2000. Ion Channels and Disease: Channelopathies. Academic Press, San Diego. 481 pp.
    1. Baukrowitz, T., and G. Yellen. 1995. Modulation of K+ current by frequency and external [K+]: a tale of two inactivation mechanisms. Neuron. 15:951–960. - PubMed
    1. Bezanilla, F. 2000. The voltage sensor in voltage-dependent ion channels. Physiol. Rev. 80:555–592. - PubMed
    1. Choi, K.L., R.W. Aldrich, and G. Yellen. 1991. Tetraethylammonium blockade distinguishes two inactivation mechanisms in voltage-activated K+ channels. Proc. Natl. Acad. Sci. USA. 88:5092–5095. - PMC - PubMed
    1. Cordero-Morales, J.F., L.G. Cuello, Y. Zhao, V. Jogini, D.M. Cortes, B. Roux, and E. Perozo. 2006. Molecular determinants of gating at the potassium-channel selectivity filter. Nat. Struct. Mol. Biol. 13:311–318. - PubMed

Publication types