. 2006 Oct 31;103(44):16254-9.
doi: 10.1073/pnas.0604860103. Epub 2006 Oct 16.

A rapid genome-scale response of the transcriptional oscillator to perturbation reveals a period-doubling path to phenotypic change

Affiliations

A rapid genome-scale response of the transcriptional oscillator to perturbation reveals a period-doubling path to phenotypic change

Caroline M Li et al. Proc Natl Acad Sci U S A. .

Abstract

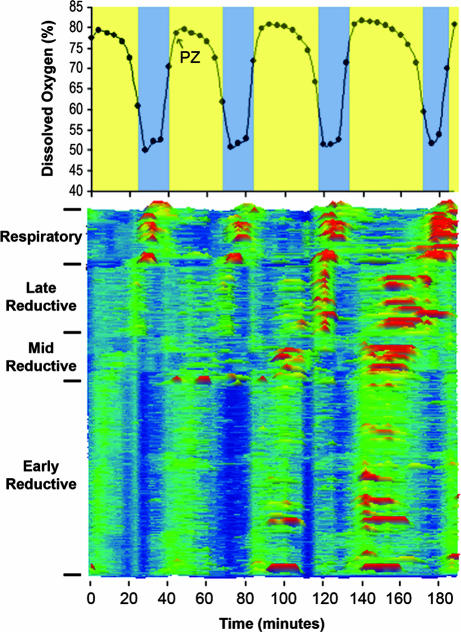
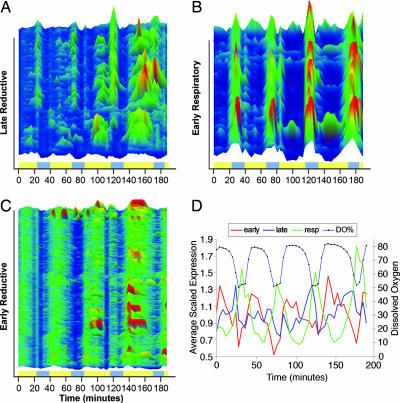
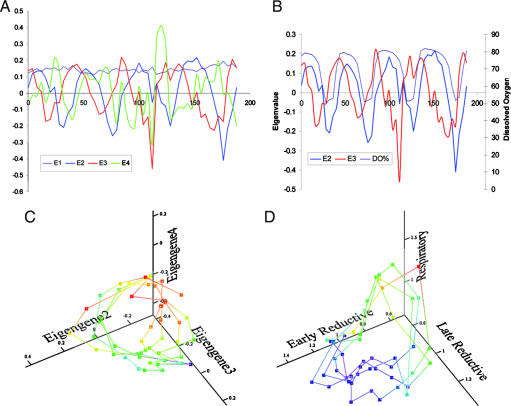
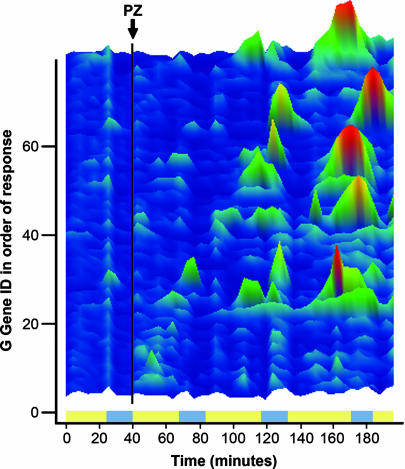
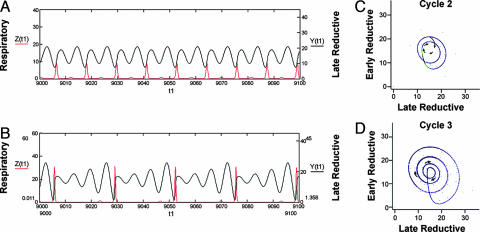
Perturbation of the gated-synchrony system in yeast with phenelzine, an antidepressant drug used in the treatment of affective disorders in humans, leads to a rapid lengthening in the period of the genome-wide transcriptional oscillation. The effect is a concerted, genome-scale change in expression that is first seen in genes maximally expressed in the late-reductive phase of the cycle, doubling the length of the reductive phase within two cycles after treatment. Clustering of genes based on their temporal patterns of expression yielded just three super clusters whose trajectories through time could then be mapped into a simple 3D figure. In contrast to transcripts in the late-reductive phase, most transcripts do not show transients in expression relative to others in their temporal cluster but change their period in a concerted fashion. Mapping the trajectories of the transcripts into low-dimensional surfaces that can be represented by simple systems of differential equations provides a readily testable model of the dynamic architecture of phenotype. In this system, period doubling may be a preferred pathway for phenotypic change. As a practical matter, low-amplitude, genome-wide oscillations, a ubiquitous but often unrecognized attribute of phenotype, could be a source of seemingly intractable biological noise in microarray studies.


Conflict of interest statement

The authors declare no conflict of interest.

Figures

Fig. 1.
Fig. 1.
Period increase in DO and transcription in response to PZ treatment. Samples for Affymetrix expression array analysis were taken at 4-min intervals through four cycles of the oscillation as indicated by the black circles on the DO curve (Upper). Bands overlying the DO oscillation indicate the respiratory phase (azure) and reductive phase (yellow). After one complete cycle of sampling, PZ was added at 1 mM at the time indicated in the figure. Transcripts were classed according to their time of maximum expression in the cycle by scaling expression to the average of the first 10 samples (control cycle) (Lower). Expression intensity is scaled from <0.2 (dark blue) to >4 (red orange). The black arrow represents the time of PZ treatment.
Fig. 2.
Fig. 2.
Late-reductive, early-reductive, and early-respiratory transcripts. (A–C) Change in phase relationships and period of transcripts after perturbation color intensity maps of the three major classes of transcripts were expanded to show the patterns after treatment. The x axis in A and B represents time in minutes. As in Fig. 1, intensity was scaled from 0.2 (dark blue) to >4 (red-orange). In D, the average expression level of all transcripts maximally expressed in early-reductive phase (red), late-reductive phase (blue), and respiratory phase (green) are shown relative to the DO curve (black). Bands indicate the respiratory phase (azure) and reductive phase (yellow).
Fig. 3.
Fig. 3.
Reconstructing the transcriptional oscillator. (A) The first four principal Eigengenes are shown for the 48 samples ordered through time from 0 to 188 min for all 5,328 genes from the PZ time series for all four cycles. Eigengenes E1–E4 as indicated by the color code in the figure contain >80% of the information. (B) Just the E2 and E3 vectors are shown to make clear the increase in the number of maxima in E3 after treatment. Plots of Eigengenes E2, E3, and E4 are shown in C as a 3D projection that emphasizes the globally cyclic nature of expression. The expansion of the trajectory in the third cycle and the increase in the number of maxima in expression seen in A and B and captured principally by Eigengenes 3 and 4 are seen in the Figs. 13 and 14. For comparison, a 3D reconstruction of the trajectory of transcript concentration from the averages of the scaled data of three major temporal clusters from Fig. 2D above is shown. The projection emphasizes the globally cyclic nature of the system.
Fig. 4.
Fig. 4.
First response changes in expression of late-reductive phase transcripts. The transcripts found to be the early strong responders to PZ are shown ordered according to the time after PZ when they are maximally different from the cluster as a whole. Scaling and color mapping are as described in Fig. 1. Gene IDs and descriptions are in Table 1. Bands indicate the respiratory phase (azure) and reductive phase (yellow).
Fig. 5.
Fig. 5.
Mapping period doubling onto a low-dimensional surface. A sketch of proposed paths in concentration phase space of the transcripts is shown based on the Rössler attractor. (A and B) A simulation of the starting and period doubled states is shown for the late-reductive genes (black) and the respiratory gene transcripts (red). Arrows in C indicate the path that would be followed by late-reductive transcripts to reach the levels seen in the first cycle after treatment cycle 2. (D) The continuing path and the state reached by the late-reductive transcripts by cycle three (second cycle after treatment). A sample simulation is shown in Appendix 1.

Comment in

Similar articles

Cited by

References

    1. Waddington CD. The Strategy of the Gene. London: Allen and Unwin; 1957.
    1. Nicolis G, Prigogine I. Proc Natl Acad Sci USA. 1971;68:2102–2107. - PMC - PubMed
    1. Mackey MC, Glass L. Science. 1977;197:287–289. - PubMed
    1. Klevecz RR, Bolen J, Forrest G, Murray DB. Proc Natl Acad Sci USA. 2004;101:1200–1205. - PMC - PubMed
    1. Klevecz RR, Ruddle FH. Science. 1968;59:634–636. - PubMed