. 2006 Oct 24;103(43):15782-7.
doi: 10.1073/pnas.0607617103. Epub 2006 Oct 16.

The genomic landscape of histone modifications in human T cells

Affiliations

The genomic landscape of histone modifications in human T cells

Tae-Young Roh et al. Proc Natl Acad Sci U S A. .

Abstract

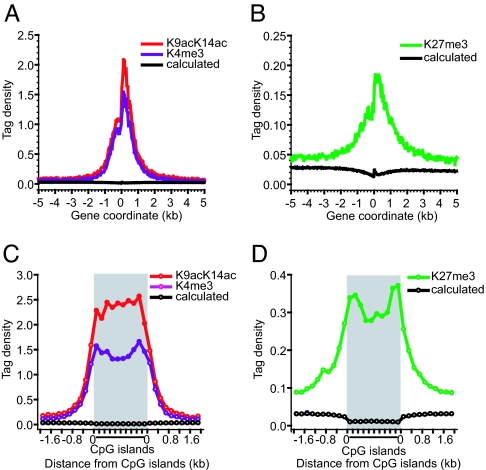
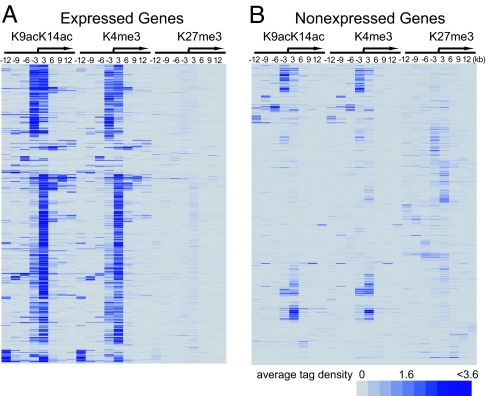
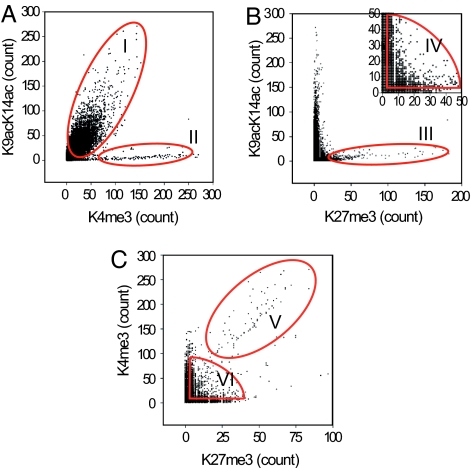
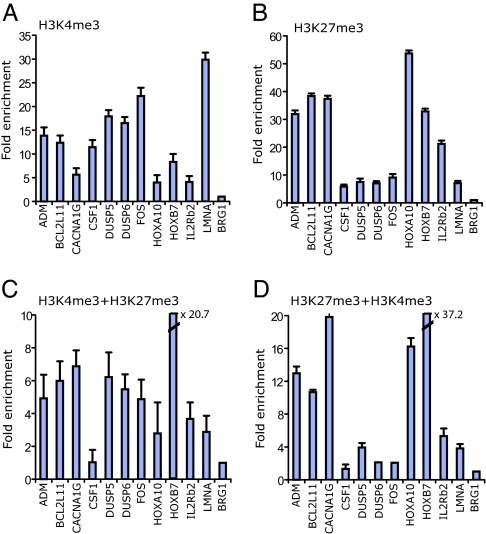
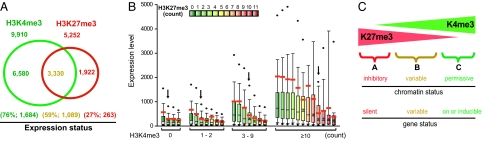
To understand the molecular basis that supports the dynamic gene expression programs unique to T cells, we investigated the genomic landscape of activating histone modifications, including histone H3 K9/K14 diacetylation (H3K9acK14ac), H3 K4 trimethylation (H3K4me3), and the repressive histone modification H3 K27 trimethylation (H3K27me3) in primary human T cells. We show that H3K9acK14ac and H3K4me3 are associated with active genes required for T cell function and development, whereas H3K27me3 is associated with silent genes that are involved in development in other cell types. Unexpectedly, we find that 3,330 gene promoters are associated with all of these histone modifications. The gene expression levels are correlated with both the absolute and relative levels of the activating H3K4me3 and the repressive H3K27me3 modifications. Our data reveal that rapidly inducible genes are associated with the H3 acetylation and H3K4me3 modifications, suggesting they assume a chromatin structure poised for activation. In addition, we identified a subpopulation of chromatin regions that are associated with high levels of H3K4me3 and H3K27me3 but low levels of H3K9acK14ac. Therefore, these regions have a distinctive chromatin modification pattern and thus may represent a distinct class of chromatin domains.


Conflict of interest statement

The authors declare no conflict of interest.

Figures

Fig. 1.
Fig. 1.
Critical transcriptional regulatory elements are targets for both active and repressive epigenetic marks. (A) Here, 10-kb regions of 21,355 genes were aligned relative to their TSSs (x axis). The y axis shows the detected tag density. The black line indicates the calculated value, assuming the tags were detected randomly. H3K9acK14ac and H3K4me3 are represented by red and dark violet lines, respectively. (B) Same as in A, except that H3K27me3 is represented by green. (C) The detected tags within 4,973 CpG islands with sizes of 1–2 kb were counted in a window corresponding to 10% of the CpG island length and normalized to the number of NlaIII sites in that window to yield the tag density. The GMAT tags outside of the CpG islands were similarly counted in a 200-bp window and normalized to the number of NlaIII sites in the window. Each value point represents 10% of the sequence length within the CpG islands and 200 bp outside of the CpG islands. The color codes are the same as in A. (D) Same as in C, except that H3K27me3 is represented by green.
Fig. 2.
Fig. 2.
H3K4me3 associates with active genes, and H3K27me3 associates with silent genes in T cells. (A) Cluster analysis of H3K9acK14ac, H3K4me3, and H3K27me3 in 1,000 highly active genes. The cluster analysis was performed by using the average tag densities calculated in 3-kb intervals over a total of 24 kb (−12 kb to +12 kb) as shown. A blue band in a segment indicates the detection of the mark, and the relative intensity of band indicates the relative level of the modification. The arrow indicates the TSS. (B) Cluster analysis of H3K9acK14ac, H3K4me3, and H3K27me3 in 1,000 nonexpressed genes, as described in A.
Fig. 3.
Fig. 3.
The H3K4me3 modification for the TCR-inducible NFATC1 (A), NFATC2 (B), and NFATC3 (C) genes and H3K27me3 modification for the silent and noninducible NFATC4 gene (D) are shown. The positions of these genes are indicated. x axis, chromosome coordinate of the locus. y axis, level of the modification as indicated by the detection frequency of the GMAT tags.
Fig. 4.
Fig. 4.
Genome-wide colocalization analysis of the H3K9acK14ac, H3K4me3, and H3K27me3 modifications. Pairwise scatter analyses of the histone modifications. The histone modifications indicated were analyzed by using GMAT. The number of tags (tag count) detected in 3-kb windows was calculated across the entire human genome. The scatter analyses of the tag counts were performed by comparing two histone modifications in AC, as indicated. B Inset shows the windows with low to moderate tag numbers between 3 and 50.
Fig. 5.
Fig. 5.
Colocalization of H3K4me3 and H3K27me3 signals is confirmed by sequential ChIP assays. (A and B) ChIP assays were performed by using anti-H3K4me3 (A) and anti-H3K27me3 (B) antibodies. The fold enrichment of different promoters relative to a BRG1 upstream region was determined by using real-time quantitative PCR. (C and D) Sequential ChIP experiments. (C) H3K4me3 + H3K27me3, sequential ChIP using first the H3K4me3 antibody followed by the H3K27me3 antibody. (D) H3K27me3 + H3K4me3, sequential ChIP using first the H3K27me3 antibody followed by the H3K4me3 antibody. The fold enrichment was determined as described above. The experiments were performed in triplicate.
Fig. 6.
Fig. 6.
Gene expression levels correlate with both the absolute and the relative levels of the H3K27me3 and H3K4me3 modifications. (A) The Venn diagram depicts the promoters associated with three tags or more of H3K4me3 (green circle) and H3K27me3 (red circle). The percentage of genes expressed and the average expression levels detected by DNA microarrays are indicated in parentheses below the circles. (B) Box-and-whisker plot showing the range of gene expression levels correlated with the histone modifications. The genes are grouped first according to H3K4me3 levels (by the total GMAT tag count in a 3-kb promoter region) and then subgrouped according to H3K27me3 levels (by the total GMAT tag count in a 3-kb promoter region). The y axis represents the arbitrary gene expression levels detected by DNA microarray analysis. The number of H3K27me3 tags corresponding to an ≈50% decrease in expression levels is indicated by the arrow above the column. The boundary of the box closest to 0 indicates the 25th percentile; the line within the box indicates the median; the boundary of the box farthest from 0 indicates the 75th percentile; and whiskers above and below the box indicate the 5th and 95th percentiles, respectively. The outlying points are shown as filled circles. The red thick lines indicate the mean values of each group. ∗ indicates that the decrease in gene expression levels compared with no H3K27me3 tags is significant (P < 0.01). (C) A Model. An inhibitory or permissive chromatin structure is generated by coexistence of the H3K27me3 and H3K4me3 modifications.

References

    1. Berger SL. Curr Opin Genet Dev. 2002;12:142–148. - PubMed
    1. Wu J, Grunstein M. Trends Biochem Sci. 2000;25:619–623. - PubMed
    1. Kornberg RD, Lorch Y. Curr Opin Genet Dev. 1999;9:148–151. - PubMed
    1. Kurdistani SK, Grunstein M. Nat Rev Mol Cell Biol. 2003;4:276–284. - PubMed
    1. Zhang Y, Reinberg D. Genes Dev. 2001;15:2343–2360. - PubMed

Publication types