

Injuries sustained by rugby players presenting to United States emergency departments, 1978 through 2004
- PMID: 17043702
- PMCID: PMC1569558
Injuries sustained by rugby players presenting to United States emergency departments, 1978 through 2004
Abstract
Context: Although the United States has nearly 60 000 rugby players, to date no nationally representative rugby injury studies have been conducted.
Objective: To describe rugby players with injuries presenting to a representative sample of US emergency departments from 1978 through 2004.
Design: Retrospective study.
Setting: US Consumer Products Safety Commission's National Electronic Injury Surveillance System.
Patients or other participants: Rugby players presenting to emergency departments in participating hospitals from October 1, 1978, through December 31, 2004.
Main outcome measure(s): We reviewed all rugby players with injuries captured by the National Electronic Injury Surveillance System and categorized them by sex, age, injury site, and injury diagnosis.
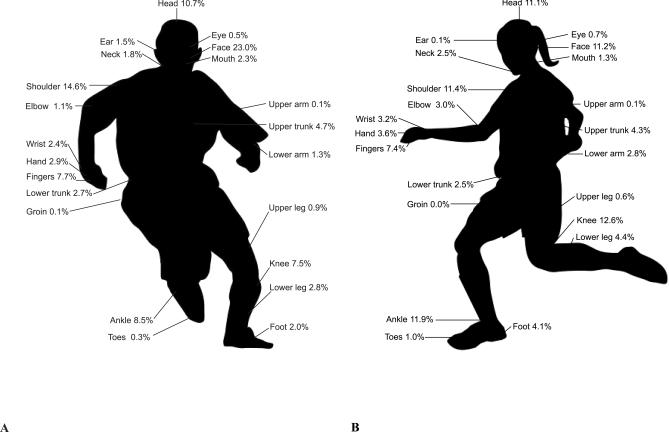
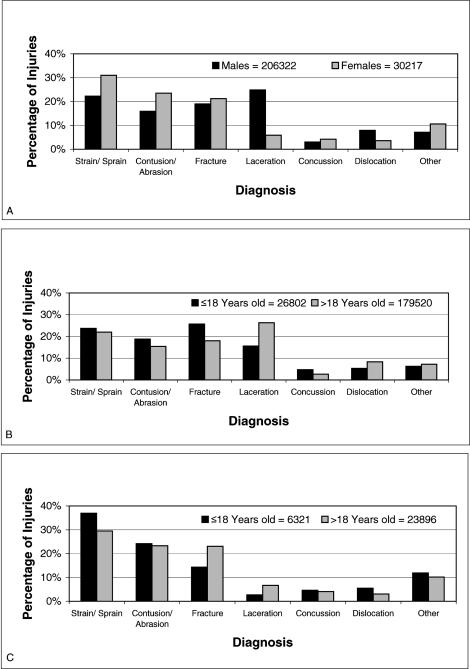
Results: An estimated 236 539 rugby players presented to US emergency departments from 1978 through 2004. Injured athletes tended to be male (87.2%) and older than 18 years of age (86.0%). The face (20.5%), shoulder (14.1%), head (11.5%), and ankle (9.1%) were the most frequently injured sites. Strain/sprain (24.3%), laceration (22.1%), fracture (18.7%), and contusion/abrasion (16.6%) were the most common diagnoses. Males presented with more face injuries (injury proportion ratio [IPR] = 2.05, 95% confidence interval [CI] = 1.54-2.72, P < .001) and more lacerations (IPR = 4.23, 95% CI = 2.87-6.22, P < .001) and dislocations (IPR = 2.17, 95% CI 1.51-3.13, P < .001). Females presented with more knee injuries (IPR = 1.67, 95% CI = 1.36-2.06, P < .001) and more contusions/abrasions (IPR = 1.48, 95% CI = 1.14-1.92, P < .001) and strains/sprains (IPR = 1.39, 95% = CI 1.16-1.67, P < .001). Those 18 years of age or younger presented with more concussions (IPR = 1.62, 95% CI = 1.06-2.50, P < .001), while those over 18 presented with more lacerations (IPR = 1.83, 95% CI = 1.30-2.57, P < .001). In males, fractures were more common among those 18 years of age or younger (IPR = 1.47, 95% CI = 1.24-1.75, P < .001).
Conclusions: Rugby injury patterns in the United States differed by age and sex. Understanding such patterns should assist certified athletic trainers in developing targeted preventive interventions.
Figures


References
-
- International Rugby Board. Member Unions: United States of America Rugby. Available at: http://www.irb.com/InTouch/Regions/UnionInfo.htm?Country=USA. Accessed September 2005 .
-
- Carson JD, Roberts MA, White AL. The epidemiology of women's rugby injuries. Clin J Sport Med. 1999;9:75–78. - PubMed
LinkOut - more resources
Full Text Sources