

Transgenic mice carrying the H258N mutation in the gene encoding the beta-subunit of phosphodiesterase-6 (PDE6B) provide a model for human congenital stationary night blindness
- PMID: 17044014
- PMCID: PMC2753261
- DOI: 10.1002/humu.20425
Transgenic mice carrying the H258N mutation in the gene encoding the beta-subunit of phosphodiesterase-6 (PDE6B) provide a model for human congenital stationary night blindness
Abstract
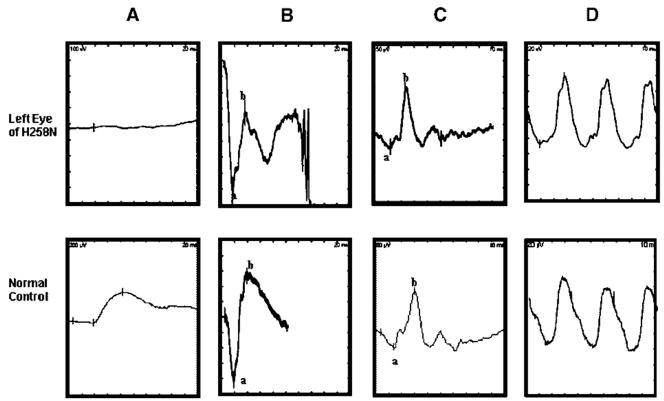
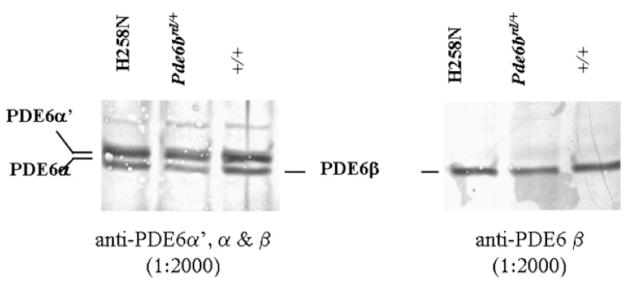
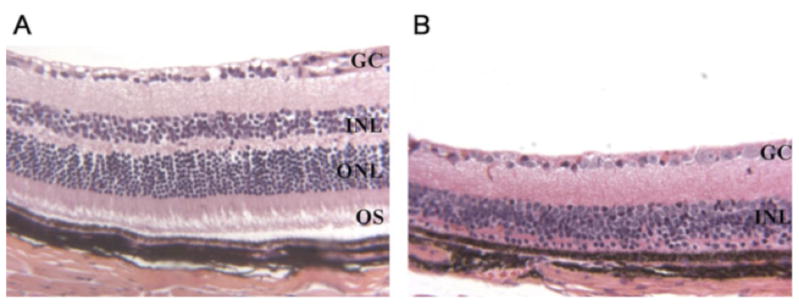
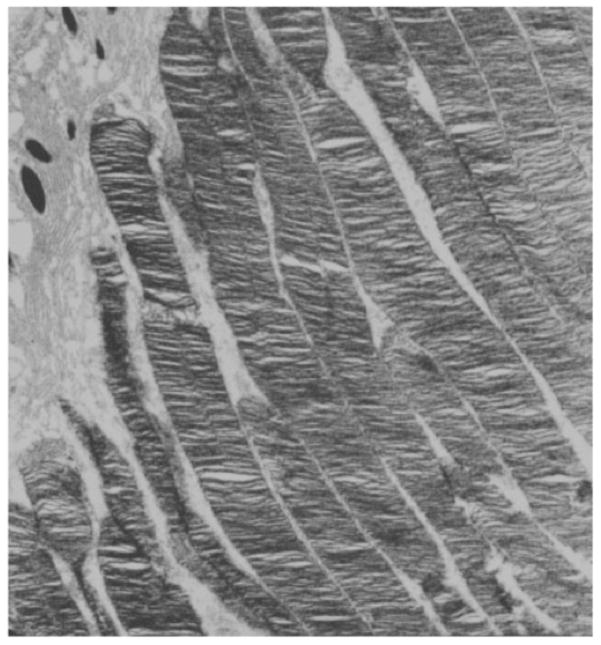
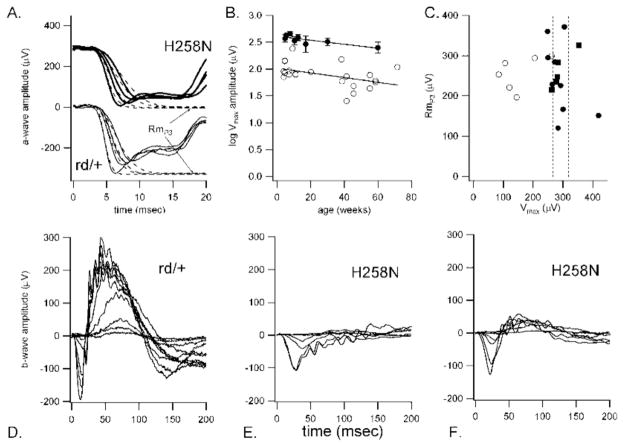
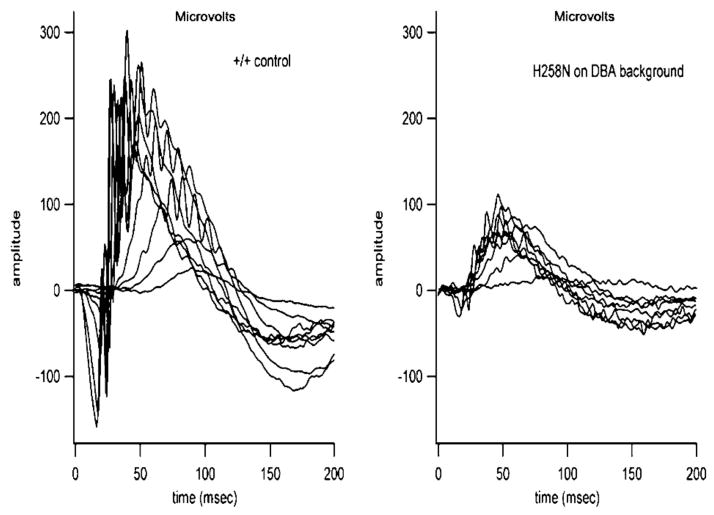
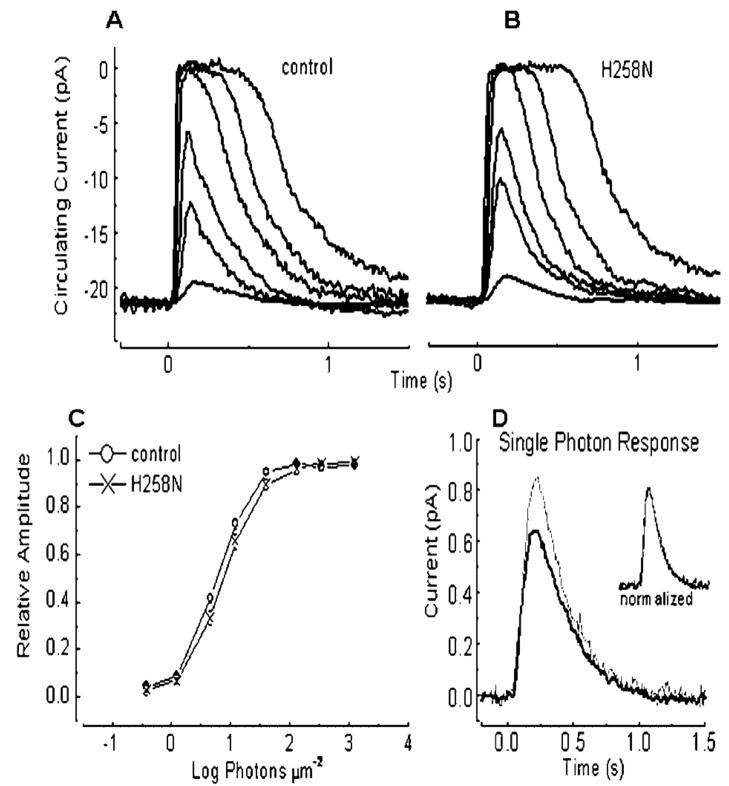
Mutations in the beta-subunit of cGMP-phosphodiesterase (PDE6beta) can lead to either progressive retinal disease, such as human retinitis pigmentosa (RP), or stationary disease, such as congenital stationary night blindness (CSNB). Individuals with CSNB in the Rambusch pedigree were found to carry the H258N allele of PDE6B (MIM# 180072); a similar mutation was not found in RP patients. This report describes an individual carrying the H258N allele, who presented with generalized retinal dysfunction affecting the rod system and a locus of dysfunction at the rod-bipolar interface. Also described are preclinical studies in which transgenic mice with the H258N allele were generated to study the pathophysiological mechanisms of CSNB. While Pde6b(rd1)/Pde6b(rd1) mice have severe photoreceptor degeneration, as in human RP, the H258N transgene rescued these cells. The cGMP-PDE6 activity of dark-adapted H258N mice showed an approximate three-fold increase in the rate of retinal cGMP hydrolysis: from 130.1 nmol x min(-1) x nmol(-1) rhodopsin in wild-type controls to 319.2 nmol x min(-1) x nmol(-1) rhodopsin in mutants, consistent with the hypothesis that inhibition of the PDE6beta activity by the regulatory PDE6gamma subunit is blocked by this mutation. In the albino (B6CBA x FVB) F2 hybrid background, electroretinograms (ERG) from H258N mice were similar to those obtained from affected Rambusch family members, as well as humans with the most common form of CSNB (X-linked), demonstrating a selective loss of the b-wave with relatively normal a-waves. When the H258N allele was introduced into the DBA background, there was no evidence of selective reduction in b-wave amplitudes; rather a- and b-wave amplitudes were both reduced. Thus, factors other than the PDE6B mutation itself could contribute to the variance of an electrophysiological response. Therefore, caution is advisable when interpreting physiological phenotypes associated with the same allele on different genetic backgrounds. Nevertheless, such animals should be of considerable value in further studies of the molecular pathology of CSNB.
Figures
References
-
- Arshavsky VY, Dumke CL, Bownds MD. Noncatalytic cGMP-binding sites of amphibian rod cGMP phosphodiesterase control interaction with its inhibitory γ-subunits. A putative regulatory mechanism of the rod photoresponse. J Biol Chem. 1992;267:24501–24507. - PubMed
-
- Arshavsky VY, Lamb TD, Pugh EN., Jr G proteins and photo-transduction. Annu Rev Physiol. 2002;64:153–187. - PubMed
-
- Austin CP, Battey JF, Bradley A, Bucan M, Capecchi M, Collins FS, Dove WF, Duyk G, Dymecki S, Eppig JT, Grieder FB, Heintz N, Hicks G, Insel TR, Joyner A, Koller BH, Lloyd KC, Magnuson T, Moore MW, Nagy A, Pollock JD, Roses AD, Sands AT, Seed B, Skarnes WC, Snoddy J, Soriano P, Stewart DJ, Stewart F, Stillman B, Varmus H, Varticovski L, Verma IM, Vogt TF, von Melchner H, Witkowski J, Woychik RP, Wurst W, Yancopoulos GD, Young SG, Zambrowicz B. The knockout mouse project. Nat Genet. 2004;36:921–924. - PMC - PubMed
-
- Baehr W, Devlin MJ, Applebury ML. Isolation of bovine ROS phosphodiesterase. J Biol Chem. 1979;254:11669–11677. - PubMed
-
- Bailey DW. Phylogenetic analysis. In: Morse HC, editor. Origins of inbred mice. New York: Academic Press: Wiley-Interscience; 1978. p. 15.
Publication types
MeSH terms
Substances
Grants and funding
LinkOut - more resources
Full Text Sources
Other Literature Sources
Medical
Molecular Biology Databases
Miscellaneous
