Comparative Study
. 2007 Jan;210(1):111-21.
doi: 10.1002/jcp.20828.

Distinctive gene expression of prostatic stromal cells cultured from diseased versus normal tissues

Affiliations
Comparative Study

Distinctive gene expression of prostatic stromal cells cultured from diseased versus normal tissues

Hongjuan Zhao et al. J Cell Physiol. 2007 Jan.

Abstract

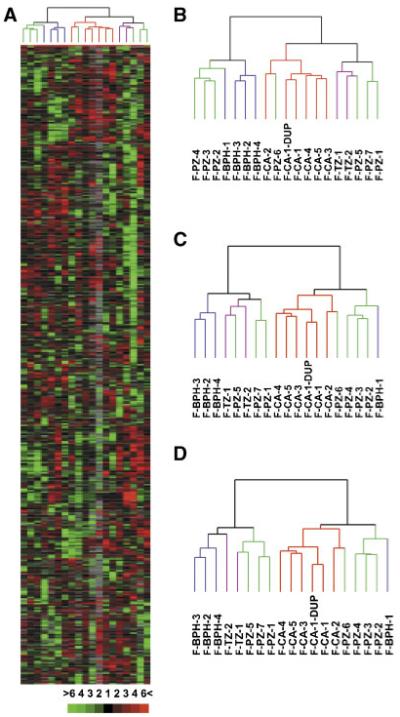
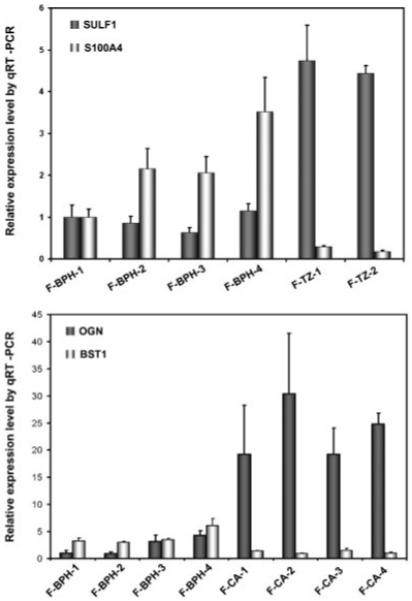
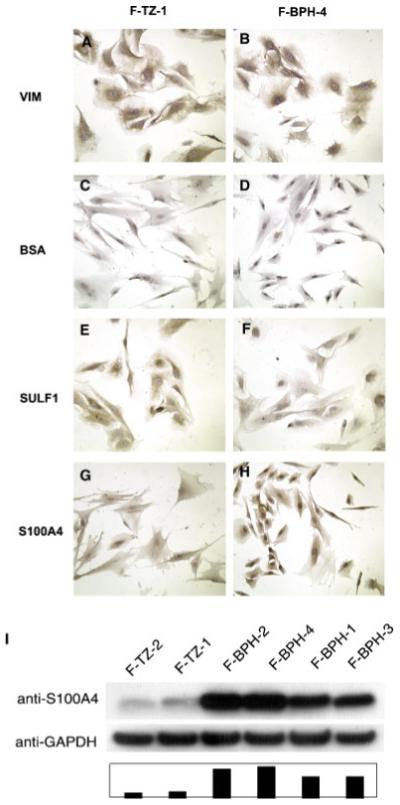
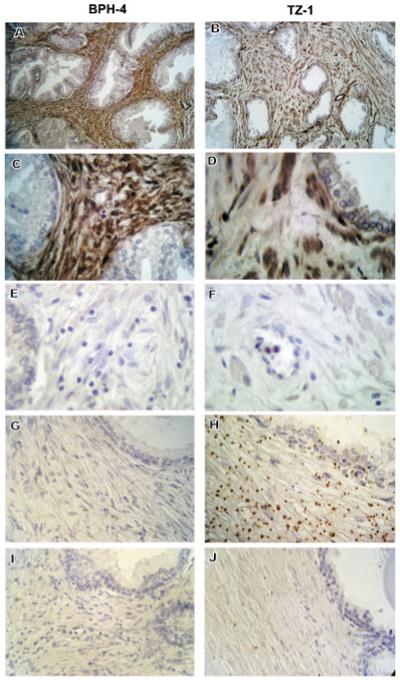
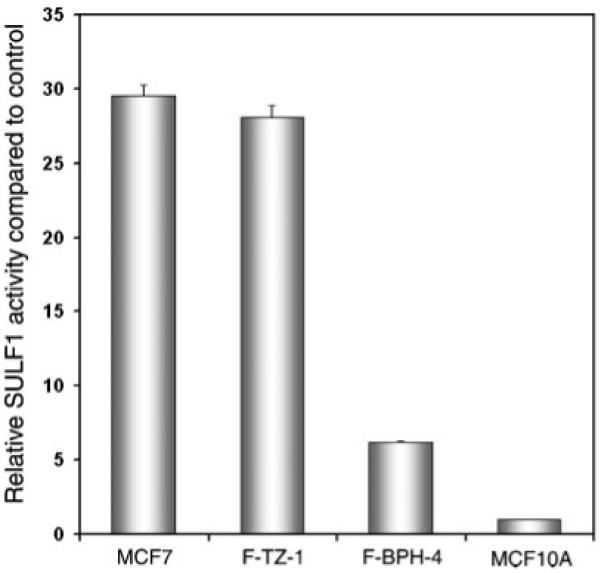
To obtain a comprehensive view of the transcriptional programs in prostatic stromal cells of different histological/pathological origin, we profiled 18 adult human stromal cell cultures from normal transition zone (TZ), normal peripheral zone (PZ), benign prostatic hyperplasia (BPH), and prostate cancer (CA) using cDNA microarrays. A hierarchical clustering analysis of 714 named unique genes whose expression varied at least threefold from the overall mean abundance in at least three samples in all 18 samples demonstrated that cells of different origin displayed distinct gene expression profiles. Many of the differentially expressed genes are involved in biological processes known to be important in the development of prostatic diseases including cell proliferation and apoptosis, cell adhesion, and immune response. Significance Analysis of Microarrays (SAM) analysis identified genes that showed differential expression with statistical significance including 24 genes between cells from TZ versus BPH, 34 between BPH versus CA, and 101 between PZ versus CA. S100A4 and SULF1, the most up- and downregulated genes in BPH versus TZ, respectively, showed expression at the protein level consistent with microarray analysis. In addition, sulfatase assay showed that BPH cells have lower SULF1 activity compared to TZ cells. Quantitative real-time polymerase chain reaction (qRT-PCR) analysis confirmed differential expression of ENPP2/autotoxin and six other genes between PZ versus CA, as well as differential expression of six genes between BPH versus CA. Our results support the hypothesis that prostatic stromal cells of different origin have unique transcriptional programs and point towards genes involved in actions of stromal cells in BPH and CA.


Figures

Fig. 1
Fig. 1
Hierarchical clustering analysis of genes differentially expressed in prostatic stromal cells. A: Overview of relative expression levels of 714 genes represented by 1,032 clones whose expression varied at least threefold from the mean abundance in at least three samples in all 18 stromal cell cultures. Each column represents data from a single stromal cell culture, and each row represents expression levels for a single gene across the 18 samples. Transcripts upregulated were in red and downregulated in green. The degree of color saturation corresponds with the ratio of gene expression shown at the bottom of the image. Full transcript identities and raw data are available at http://www.Stanford.edu/∼hongjuan/stromal. In the dendrogram shown on top of the image, BPH cells were colored in blue, CA cells in red, PZ cells in green, and TZ cells in purple. The same color code was used in (B-D). B: Dendrogram of clustering analysis using the 1,032 clones described in (A). C: Dendrogram of clustering analysis using 455 clones representing 361 genes whose expression varied at least threefold from the mean abundance in at least four samples in all 18 stromal cell cultures. D: Dendrogram of clustering analysis using 232 clones representing 192 genes whose expression varied at least fourfold from the mean abundance in at least four samples in all 18 stromal cell cultures. [Color figure can be viewed in the online issue, which is available at www.interscience.wiley.com.]
Fig. 2
Fig. 2
Validation of gene expression changes observed using microarray by real-time RT-PCR. Levels of transcripts of interest determined by PT-PCR in triplicates were normalized against that of TBP in the same sample. For comparison, expression levels in F-BPH-1 were scaled to 1, except for BST1, for which expression level in F-CA-4 was scaled to 1.
Fig. 3
Fig. 3
Comparison of SULF1 and S100A4 expression in cultured BPH and TZ cells by immunochemistry (A-H) and Western blotting (I). SULF1 expression is significantly less in F-BPH-4 cells (E) compared to F-TZ-1 cells (F), whereas S100A4 expression is much higher in F-BPH-4 cells (G) than in F-TZ-1 cells (H). Both cell cultures showed similar uniform expression of vimentin (A, B) and no staining when BSA was used as negative control (C, D). Western blotting (I) showed S100A4 expression was decreased in BPH cells, ranging from 7.7- to 10.7-fold, compared to TZ cells. [Color figure can be viewed in the online issue, which is available at www.interscience.wiley.com.]
Fig. 4
Fig. 4
Comparison of S100A4 and SULF1 expression in tissue sections of BPH and TZ. Intense staining of S100A4 by immunohistochemistry was observed throughout the stromal area of BPH tissue from which the cell culture, F-BPH-4, was derived (A), whereas only some stromal cells showed expression of S100A4 in the normal TZ tissue from which F-TZ-1 was derived (B). C and D are higher magnification of (A) and (B), respectively. E and F are negative controls stained with BSA. In situ hybridization using anti-sense RNA probe against SULF1 showed that SULF1 transcript is present at high levels in the stroma of normal TZ tissue (H), but not in BPH stroma (G), whereas sense RNA probe did not show labeling in either BPH (I) or TZ (J) stroma. [Color figure can be viewed in the online issue, which is available at www.interscience.wiley.com.]
Fig. 5
Fig. 5
Sulfatase assay in cultured BPH and TZ stromal cells. Relative activity was calculated by scaling the activity in MCF-10A cells, the negative control, to 1. MCF-7 cells were used as a positive control. F-BPH-4 cells showed a more than fourfold decrease in SULF1 activity compared to F-TZ-1 cells.

References

    1. Ayala G, Tuxhorn JA, Wheeler TM, Frolov A, Scardino PT, Ohori M, Wheeler M, Spitler J, Rowley DR. Reactive stroma as a predictor of biochemical-free recurrence in prostate cancer. Clin Cancer Res. 2003;9(13):4792–4801. - PubMed
    1. Barclay WW, Woodruff RD, Hall MC, Cramer SD. A system for studying epithelial-stromal interactions reveals distinct inductive abilities of stromal cells from benign prostatic hyperplasia and prostate cancer. Endocrinology. 2005;146(1):13–18. - PMC - PubMed
    1. Black EJ, Clair T, Delrow J, Neiman P, Gillespie DA. Microarray analysis identifies Autotaxin, a tumour cell motility and angiogenic factor with lysophospholipase D activity, as a specific target of cell transformation by v-Jun. Oncogene. 2004;23(13):2357–2366. - PubMed
    1. Brindley DN. Lipid phosphate phosphatases and related proteins: Signaling functions in development, cell division, and cancer. J Cell Biochem. 2004;92(5):900–912. - PubMed
    1. Brooks JD. Microarray analysis in prostate cancer research. Curr Opin Urol. 2002;12(5):395–399. - PubMed

Publication types

MeSH terms