. 2006 Sep 22;2(9):e148.
doi: 10.1371/journal.pgen.0020148. Epub 2006 Jul 31.

The influence of recombination on human genetic diversity

Affiliations

The influence of recombination on human genetic diversity

Chris C A Spencer et al. PLoS Genet. .

Abstract

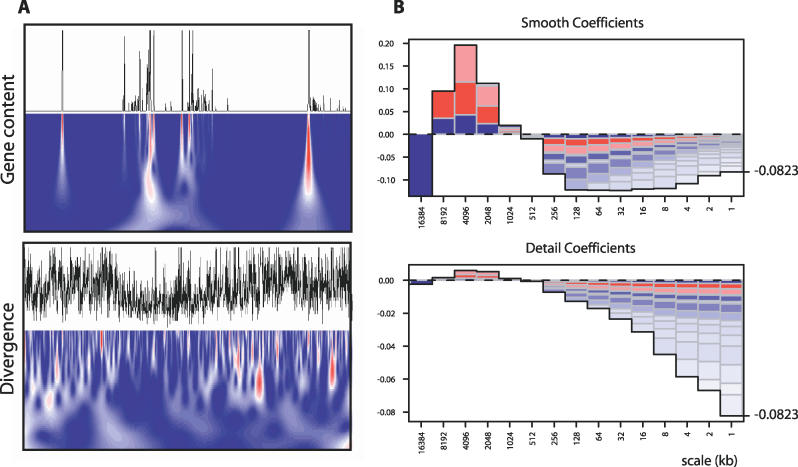
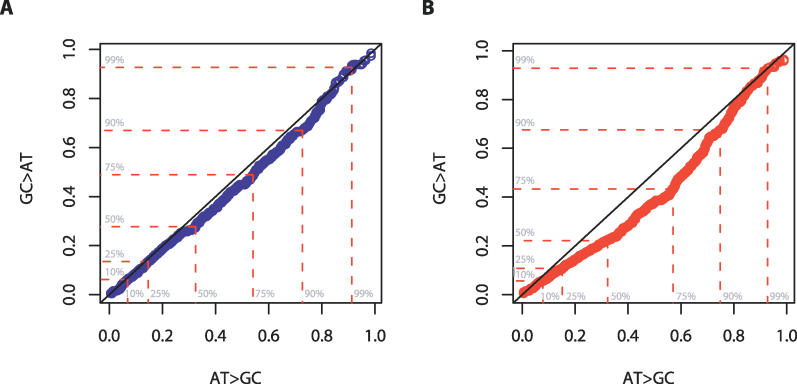
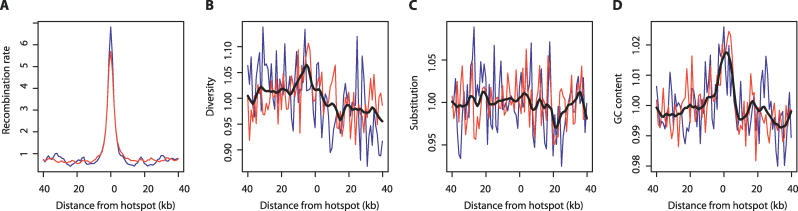
In humans, the rate of recombination, as measured on the megabase scale, is positively associated with the level of genetic variation, as measured at the genic scale. Despite considerable debate, it is not clear whether these factors are causally linked or, if they are, whether this is driven by the repeated action of adaptive evolution or molecular processes such as double-strand break formation and mismatch repair. We introduce three innovations to the analysis of recombination and diversity: fine-scale genetic maps estimated from genotype experiments that identify recombination hotspots at the kilobase scale, analysis of an entire human chromosome, and the use of wavelet techniques to identify correlations acting at different scales. We show that recombination influences genetic diversity only at the level of recombination hotspots. Hotspots are also associated with local increases in GC content and the relative frequency of GC-increasing mutations but have no effect on substitution rates. Broad-scale association between recombination and diversity is explained through covariance of both factors with base composition. To our knowledge, these results are the first evidence of a direct and local influence of recombination hotspots on genetic variation and the fate of individual mutations. However, that hotspots have no influence on substitution rates suggests that they are too ephemeral on an evolutionary time scale to have a strong influence on broader scale patterns of base composition and long-term molecular evolution.


Conflict of interest statement

Competing interests. The authors have declared that no competing interests exist.

Figures

Figure 1
Figure 1. Wavelet Transformation of Genome Annotations
(A) To illustrate the purpose of wavelet transformation, we show the original traces and continuous wavelet transformations using the derivative of Gaussian wavelet basis for gene content and divergence over a 2-Mb stretch of Chromosome 20. Colours indicate the magnitude (blue = low, red = high, white = zero) of the wavelet coefficients at each scale and location, with each level being normalised to have equal variance. (B) Analysis of the correlation between the smoothed and detailed coefficients at each scale (see Text S2). The height of each bar is the value of the correlation coefficient and the boxes are the contributions from broader scales (top is the broadest scale), with colour intensity related to the magnitude of the effect (blue is negative, red is positive) and size proportional to the fraction of variance explained by a given level. The correlation between divergence and constraint in the original signal (−0.0823) can be decomposed into positive contributions from correlations between detail coefficients at broad scales and negative contributions from correlations between detail coefficients at fine scales.
Figure 2
Figure 2. Power Spectra and Pairwise Correlations of Detail Wavelet Coefficients
Diagonal plots show the power spectrum of the wavelet decomposition of each factor on the long (red) and short (blue) arms of Chromosome 20. Off-diagonal plots show the rank correlation coefficient between pairs of detail wavelet coefficients at each scale on the long (top right) and short (bottom left) arms. Red crosses indicate significant correlations (p-value < 0.01; Kendall's rank correlation). Scale is shown in kilobases.
Figure 3
Figure 3. Marginal Significance (−log10 p-value as Determined by t-Test) of the Wavelet Coefficients from Four Annotations as Predictors of the Coefficients of the Decomposition of Ascertainment Panel Diversity
Red boxes highlight significant positive linear relationships and blue negative. The intensity of the colour is proportional to the degree of significance. (A) Smoothed coefficients. (B) Detail coefficients. Also shown is the adjusted r 2, which can be interpreted as the proportion of the variance in the signal explained by the linear model.
Figure 4
Figure 4. Marginal Significance (−log10 p-value as Determined by t-Test) of the Wavelet Coefficients from Four Annotations as Predictors of the Coefficients of the Decomposition of Human-Chimpanzee Divergence
Red boxes highlight significant positive linear relationships, and blue boxes, negative. The intensity of the colour is proportional to the degree of significance. (A) Smoothed coefficients. (B) Detail coefficients.
Figure 5
Figure 5. Quantile-Quantile Plots Showing the Difference in Allele Frequency Spectrum for AT→GC Mutations and GC→AT Mutations in Regions of Low and High Recombination
If the two types of mutation were to have the same allele frequency distribution, we would expect to see a straight line. In both cases, AT→GC mutations are typically at higher frequencies than GC→AT mutations; however, the effect is more pronounced in regions of high recombination [(A), low recombination; (B), high recombination]. A quantification of the difference can be found in the text and supporting material.
Figure 6
Figure 6. Effects of Recombination Hotspots on Genomic Features
(A) The elevation of relative recombination rate around defined hotspots on the short (blue) and long (red) arms of Chromosome 20. (B) Elevation of relative diversity around hotspots (the black line is a smoothed average of the two arms). (C) There is no effect of hotspots on relative divergence. (D) Hotspots are associated with local increases in relative GC content. Note that a relative scale was used because the long and short arms can have systematic differences in absolute value.

References

    1. Maynard Smith J, Haigh J. The hitch-hiking effect of a favourable gene. Genet Res. 1974;23:23–35. - PubMed
    1. Nachman MW, Bauer VL, Crowell SL, Aquadro CF. DNA variability and recombination rates at X-linked loci in humans. Genetics. 1998;150:1133–1141. - PMC - PubMed
    1. Nachman MW. Single nucleotide polymorphisms and recombination rate in humans. Trends Genet. 2001;17:481–485. - PubMed
    1. Payseur BA, Nachman MW. Gene density and human nucleotide polymorphism. Mol Biol Evol. 2002;19:336–340. - PubMed
    1. Wolfe KH, Sharp PM, Li WH. Mutation rates differ among regions of the mammalian genome. Nature. 1989;337:283–285. - PubMed

Publication types