Comparison of protein interaction networks reveals species conservation and divergence
- PMID: 17044912
- PMCID: PMC1630707
- DOI: 10.1186/1471-2105-7-457
Comparison of protein interaction networks reveals species conservation and divergence
Abstract
Background: Recent progresses in high-throughput proteomics have provided us with a first chance to characterize protein interaction networks (PINs), but also raised new challenges in interpreting the accumulating data.
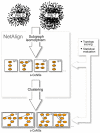
Results: Motivated by the need of analyzing and interpreting the fast-growing data in the field of proteomics, we propose a comparative strategy to carry out global analysis of PINs. We compare two PINs by combining interaction topology and sequence similarity to identify conserved network substructures (CoNSs). Using this approach we perform twenty-one pairwise comparisons among the seven recently available PINs of E.coli, H.pylori, S.cerevisiae, C.elegans, D.melanogaster, M.musculus and H.sapiens. In spite of the incompleteness of data, PIN comparison discloses species conservation at the network level and the identified CoNSs are also functionally conserved and involve in basic cellular functions. We investigate the yeast CoNSs and find that many of them correspond to known complexes. We also find that different species harbor many conserved interaction regions that are topologically identical and these regions can constitute larger interaction regions that are topologically different but similar in framework. Based on the species-to-species difference in CoNSs, we infer potential species divergence. It seems that different species organize orthologs in similar but not necessarily the same topology to achieve similar or the same function. This attributes much to duplication and divergence of genes and their associated interactions. Finally, as the application of CoNSs, we predict 101 protein-protein interactions (PPIs), annotate 339 new protein functions and deduce 170 pairs of orthologs.
Conclusion: Our result demonstrates that the cross-species comparison strategy we adopt is powerful for the exploration of biological problems from the perspective of networks.
Figures


Similar articles
-
NetAlign: a web-based tool for comparison of protein interaction networks.Bioinformatics. 2006 Sep 1;22(17):2175-7. doi: 10.1093/bioinformatics/btl287. Epub 2006 Jun 9. Bioinformatics. 2006. PMID: 16766562
-
Topology-function conservation in protein-protein interaction networks.Bioinformatics. 2015 May 15;31(10):1632-9. doi: 10.1093/bioinformatics/btv026. Epub 2015 Jan 20. Bioinformatics. 2015. PMID: 25609797 Free PMC article.
-
Identifying conserved protein complexes between species by constructing interolog networks.BMC Bioinformatics. 2013;14 Suppl 16(Suppl 16):S8. doi: 10.1186/1471-2105-14-S16-S8. Epub 2013 Oct 22. BMC Bioinformatics. 2013. PMID: 24564762 Free PMC article.
-
Discerning molecular interactions: A comprehensive review on biomolecular interaction databases and network analysis tools.Gene. 2018 Feb 5;642:84-94. doi: 10.1016/j.gene.2017.11.028. Epub 2017 Nov 10. Gene. 2018. PMID: 29129810 Review.
-
From protein-protein interactions to rational drug design: are computational methods up to the challenge?Curr Top Med Chem. 2013;13(5):602-18. doi: 10.2174/1568026611313050005. Curr Top Med Chem. 2013. PMID: 23548023 Review.
Cited by
-
JUMPn: A Streamlined Application for Protein Co-Expression Clustering and Network Analysis in Proteomics.J Vis Exp. 2021 Oct 19;(176):10.3791/62796. doi: 10.3791/62796. J Vis Exp. 2021. PMID: 34747401 Free PMC article.
-
The tapeworm interactome: inferring confidence scored protein-protein interactions from the proteome of Hymenolepis microstoma.BMC Genomics. 2020 May 7;21(1):346. doi: 10.1186/s12864-020-6710-1. BMC Genomics. 2020. PMID: 32380953 Free PMC article.
-
Network modelling of gene regulation.Biophys Rev. 2011 Mar;3(1):1-13. doi: 10.1007/s12551-010-0041-4. Epub 2010 Dec 23. Biophys Rev. 2011. PMID: 28510232 Free PMC article.
-
Patterns of Conservation and Diversification in the Fungal Polarization Network.Genome Biol Evol. 2018 Jul 1;10(7):1765-1782. doi: 10.1093/gbe/evy121. Genome Biol Evol. 2018. PMID: 29931311 Free PMC article.
-
Bridging topological and functional information in protein interaction networks by short loops profiling.Sci Rep. 2015 Feb 23;5:8540. doi: 10.1038/srep08540. Sci Rep. 2015. PMID: 25703051 Free PMC article.
References
-
- Ho Y, Gruhler A, Heilbut A, Bader GD, Moore L, Adams SL, Millar A, Taylor P, Bennett K, Boutilier K, Yang L, Wolting C, Wolting C, Donaldson I, Schandorff S, Shewnarane J, Vo M, Taggart J, Goudreault M, Muskat B, Alfarano C, Dewar D, Lin Z, Michalickova K, Willems AR, Sassi H, Nielsen PA, Rasmussen KJ, Andersen JR, Johansen LE, Hansen LH, Jespersen H, Podtelejnikov A, Nielsen E, Crawford J, Poulsen V, SØrensen BD, Matthiesen J, Hendrickson RC, Gleeson F, Pawson T, Moran MF, Durocher D, Mann M, Hogue CWV, Figeys D, Tyers M. Systematic identification of protein complexes in Saccharomyces cerevisiae by mass spectrometry. Nature. 2002;415:180–183. doi: 10.1038/415180a. - DOI - PubMed
-
- Tong AHY, Drees B, Nardelli G, Bader GD, Brannetti B, Castagnoli L, Evangelista M, Ferracuti S, Nelson B, Paoluzi S, Quondam M, Zucconi A, Hogue CWV, Fields S, Boone C, Cesareni G. A combined experimental and computational strategy to define protein interaction networks for peptide recognition modules. Science. 2002;295:321–324. doi: 10.1126/science.1064987. - DOI - PubMed
Publication types
MeSH terms
Substances
LinkOut - more resources
Full Text Sources
Molecular Biology Databases

