. 2006;7(10):R93.
doi: 10.1186/gb-2006-7-10-r93. Epub 2006 Oct 17.

Pathway and gene-set activation measurement from mRNA expression data: the tissue distribution of human pathways

Affiliations

Pathway and gene-set activation measurement from mRNA expression data: the tissue distribution of human pathways

David M Levine et al. Genome Biol. 2006.

Abstract

Background: Interpretation of lists of genes or proteins with altered expression is a critical and time-consuming part of microarray and proteomics research, but relatively little attention has been paid to methods for extracting biological meaning from these output lists. One powerful approach is to examine the expression of predefined biological pathways and gene sets, such as metabolic and signaling pathways and macromolecular complexes. Although many methods for measuring pathway expression have been proposed, a systematic analysis of the performance of multiple methods over multiple independent data sets has not previously been reported.

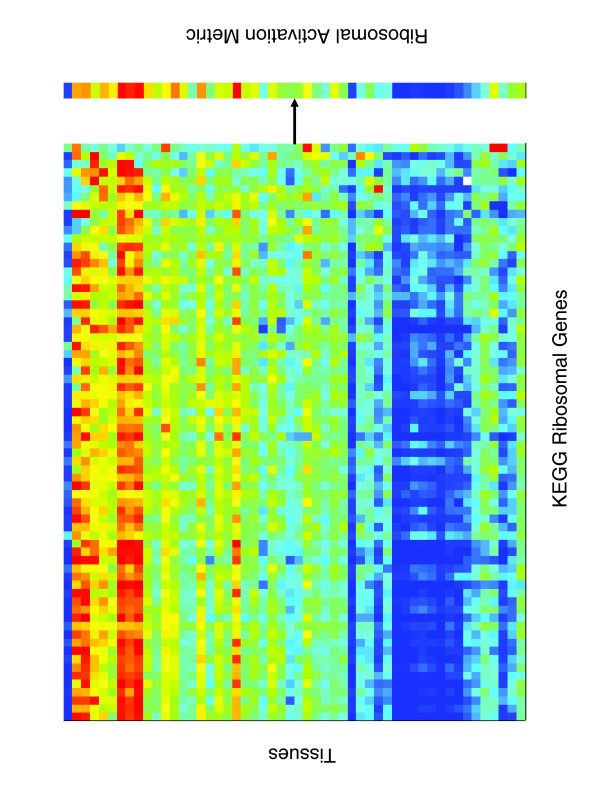
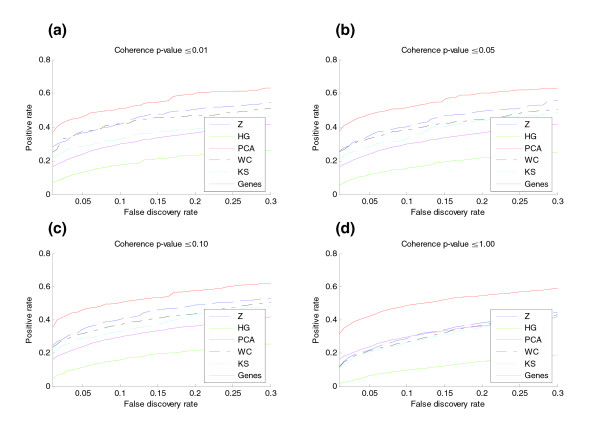
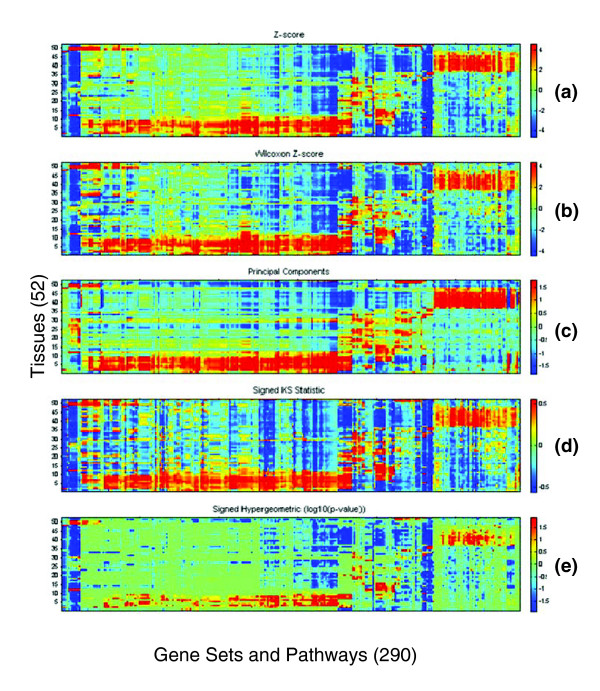
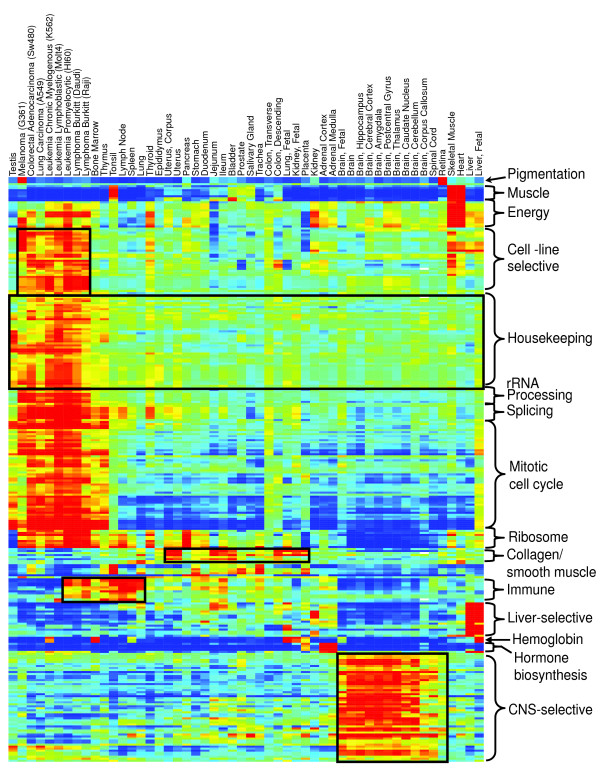
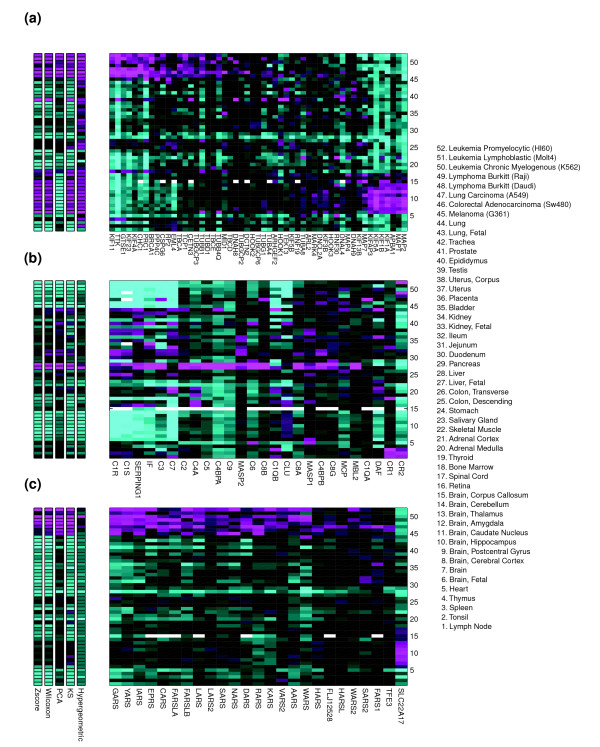
Results: Five different measures of pathway expression were compared in an analysis of nine publicly available mRNA expression data sets. The relative sensitivity of the metrics varied greatly across data sets, and the biological pathways identified for each data set are also dependent on the choice of pathway activation metric. In addition, we show that removing incoherent pathways prior to analysis improves specificity. Finally, we create and analyze a public map of pathway expression in human tissues by gene-set analysis of a large compendium of human expression data.

Conclusion: We show that both the detection sensitivity and identity of pathways significantly perturbed in a microarray experiment are highly dependent on the analysis methods used and how incoherent pathways are treated. Analysts should thus consider using multiple approaches to test the robustness of their biological interpretations. We also provide a comprehensive picture of the tissue distribution of human gene pathways and a useful public archive of human pathway expression data.


Figures

Figure 1
Figure 1
Example of pathway activation calculation. Shown on the left are the expression levels of the 70 genes in the KEGG Ribosome gene set measured across a set of tissue samples. The columns are genes and the rows are tissues. Bright red indicates overexpression of a gene relative to a pool of all tissues, and dark blue significant underexpression. For each tissue, the pathway activation metric (represented by the black arrow) is used to calculate a corresponding scalar value that captures the predominant expression of the genes in the Ribosome gene set in that tissue. Taken together, these scalar values constitute the pathway activation metric vector shown on the right.
Figure 2
Figure 2
ROC analysis was used to compare the detection sensitivity of five metrics of gene set activation and individual genes to discriminate between two different subgroups in nine different data sets (Table 1). A Wilcoxon rank sum test was used to test the null hypothesis for each gene set and individual gene that the two different subgroups groups were drawn from the same distribution. (a-d) The four graphs show results using four different p value thresholds for pathway coherence. Shown on the y-axis is the positive rate: the percentage of the gene sets or genes declared different between the two subgroups as a function of the FDR (the x-axis). The results are averaged over all nine data sets. The operating range of the X axis, [0.0, 0.3] was chosen to correspond to the range of FDRs that might be acceptable in practice. ROC curves were also calculated for each of the nine data sets individually (Supplemental Figures F1 to F9 in Additional data file 1). HG, hypergeometric; WC, Wilcoxon Z score; Z, Z score.
Figure 3
Figure 3
Comparison plot of human body atlas pathway expression computed by five different activations metrics: (a) Z score, (b) Wilcoxon Z score, (c) PCA, (d) signed KS, (e) signed hypergeometric. The rows are 52 tissues and cell lines (rows) and the columns are 290 gene sets and pathways. The order of pathways on both axes was determined by standard two-dimensional hierarchical clustering of the Z score results, and is the same as in Figure 4.
Figure 4
Figure 4
The tissue distribution of human gene pathways. A matrix of 52 tissues and cell lines (columns) versus 290 gene sets and pathways (rows). Each cell in the matrix indicates the Z score, the degree to which the genes in the pathway are over- or under-expressed relative to average (see Materials and methods). Both axes have been clustered with standard two-dimensional hierarchical clustering. A high resolution version of this figure with row labels and a table of expression Z scores of each set in each sample are available as supplemental materials from [21].
Figure 5
Figure 5
Expression of component genes for three gene sets over the tissues in the expression atlas showing varying patterns of expression coherence among the component genes. Shown to the left of each gene set are the pathway measurements calculated using each of the five activation metrics. Expression data are log10 ratio relative to average (see Materials and methods). Magenta and cyan indicate higher and lower expression of a gene or pathway in a given sample, respectively. The x-axis of each plot lists the component genes for each of three pathways: (a) 'Microtubule-based process'; (b) 'Complement Activation, Classical Pathway'; and (c) 'tRNA aminoacylation'. All are GO Biological Process categories. The 52 tissues and cell lines used in this study are listed on the y-axes of each plot. Color axes are from -0.75 to 0.75 for gene expression log10 ratios (right plots). Missing data points are in white. For the activation metrics the color axes are normalized by the maximum and minimum values to range from 0 to 1.

References

    1. Ermolaeva O, Rastogi M, Pruitt KD, Schuler GD, Bittner ML, Chen Y, Simon R, Meltzer P, Trent JM, Boguski MS. Data management and analysis for gene expression arrays. Nat Genet. 1998;20:19–23. doi: 10.1038/1670. - DOI - PubMed
    1. Eisen MB, Spellman PT, Brown PO, Botstein D. Cluster analysis and display of genome-wide expression patterns. Proc Natl Acad Sci USA. 1998;95:14863–14868. doi: 10.1073/pnas.95.25.14863. - DOI - PMC - PubMed
    1. Marcotte EM, Pellegrini M, Thompson MJ, Yeates TO, Eisenberg D. A combined algorithm for genome-wide prediction of protein function. Nature. 1999;402:83–86. doi: 10.1038/47048. - DOI - PubMed
    1. Masys DR, Welsh JB, Lynn Fink J, Gribskov M, Klacansky I, Corbeil J. Use of keyword hierarchies to interpret gene expression patterns. Bioinformatics. 2001;17:319–326. doi: 10.1093/bioinformatics/17.4.319. - DOI - PubMed
    1. Doniger SW, Salomonis N, Dahlquist KD, Vranizan K, Lawlor SC, Conklin BR. MAPPFinder: using Gene Ontology and GenMAPP to create a global gene-expression profile from microarray data. Genome Biol. 2003;4:R7. doi: 10.1186/gb-2003-4-1-r7. - DOI - PMC - PubMed

LinkOut - more resources